
Introduction
The STOP project will address the health societal challenge of obesity with the specific objectives of mitigating the enormous and growing Health Care costs of obesity and related health issues. The project proposed solution is the foundation of an innovative platform to support Persons with Obesity (PwO) with better nutrition under the supervision of Healthcare Professionals. Therefore, the STOP Platform will capture various PwO data from different kind of smart sensor streams and Chatbot technology, manage and enrich available data with existing knowledge bases and fuse these by machine learned driven Data Fusion approaches for sophisticated AI data analysis.
The WP2 has a strong relation with other WPs, especially in refining and implementing of the STOP platform architecture which is for convenience as well depicted in Figure 1-1. To provide a better overview of the integration of this report with the architecture, we will shortly summarize some key points. The architecture contains a Persistant Layer (located in the cloud), which consists of a Structured Content area (Digital Library and Multimedia Archive) for the Content and a Knowledge Network (KN) for KOs (details see D2.1). The KM-EP is based on a flexible integration architecture with service harmonization capabilities (an architecture about KM-EP could be found in D2.1).

Figure 1‑1: STOP Platform Architecture Data & Knowledge Ecosystem
As marked with different colours in the figure, the platform is combined the works of WP2 and WP3. Overall, the project Work Package 2 (WP2), which is described in this deliverable, is focused on topics related to:
- Sensory Data Fusion: Merging raw data with captured data into KOs
- Data & Knowledge Management – KM-EP: Manages the SDF input and output
- Information Visualisation: Visualise the Content and Knowledge
Other parts of the STOP platform, such as e.g. AI Chatbot and Gamification App, are reported in other deliverables. This report is the second deliverable of the work package 2 with scope on the first STOP Platform release that is conceptualised in the deliverable 2.1 (see Figure 1-2).
Figure ‑: Relation of STOP deliverables
The aim of this report is to document the project achievements to the following objectives:
- O2.2: Conduct software implementation and refinement activities of policies and workflows to enable access and use of data and meta data, managed through the STOP Platform, besides establishing security functionalities, Semantic Data Integration and Fusion.
- O2.3: Conduct software implementation and refinement activities, of innovative Visualisation algorithms and techniques to support case pilot specific user interaction with managed data.
To address the scope of this report and above objectives, project work in WP2 is split in in five tasks. The structure of this report will follow the order of tasks (from DoA) that are already worked in during various secondments. The first four tasks are already relevant for this report and copy and pasted for convenience:
- T2.1 Task lead: CIT. Contributors: FTK, Sensory interfaces Implement an initial selection of sensory interfaces for the STOP Platform. These interfaces will provide a generic approach to engage different types of wearable sensors into the STOP Platform. To be further managed and enriched through the Data Management component. (Secondment No. 2, 12, 23)
- T2.2 Task lead: CIT. Contributors: FTK, Data Fusion Research, selection and integration of machine learning algorithms to be used sensory Data Fusion. (Secondment No. 2, 12, 23)
- T2.3 Task lead: FTK. Contributors: CIT, OKK. Data & Knowledge Management: implementation, refinement and documentation Implementation, refinement and documentation of Semantic Data Integration and Fusion functionalities. This will enable broad subsequent processing and data exchange throughout system barriers and comprehensive Knowledge Management with available data. Actually, the semantic Data Fusion could as well be regarded as a semantic information integration process that enables a unified and unique data access interface. Therefore, amongst others a formal extensible ontology will be developed and validated to represent the relevant concepts and relations of the food domain. Address ethical implications that goes along with the platform implementation and refinement of workflow and access functionalities. (Secondment No. 3, 7, 25)
- T2.4 Task lead: OKK. Contributors: CIT, FTK. Visualisation: Implementation, refinement and documentation. An intuitive visualisation dashboard will be designed that is personalised to each user. The visualisation will complete the loop in the quantified-self paradigm by enabling effective feedback for reflection, planning, actionable insights and for self-understanding. The visualisation will be co-designed with users to ensure that it is useful and user-centred. The visualisation will be interactive in nature and will allow the user to interrogate the data on multiple levels of detail where the sophistication and granularity is controlled by the user. Interpretation of the visualisation will be validated using the concurrent think-aloud protocol otherwise known as a cognitive walkthrough with users. Finally, the visualisation will be audited using design principles and heuristics from Gestalt psychology. (Secondment No. 8 & 13).
The report documents four cognitive walk through of the Platform components Data and Knowledge Management, Sensory Data Fusion, and Data Visualisation. Each walkthrough demonstrates stepwise the functionality of the system components with screenshots and their descriptions.
Data and Knowledge Management: Cognitive Walkthrough
In this section, the Data and Knowledge Management developed in the context of the STOP project is presented. The walkthrough is split into a description of the data management functionality for the management of fitness data and a section that reports on the functionality for knowledge management.
Fitness Data Management
Fitness Data Manager supports users in the task of importing, creating, and managing their fitness data. They consist of several modules that helps to manage users’ activities, exercises, food and water consumptions, weights, and goals.
User Registration
Go to the STOP portal at https://stop.projekt.onl/. Users are required to login using their username and password. Unregistered users click on “Register” button to go to the registration page (see Figure 2‑1).

Figure ‑: User registration UI
Users will need to fill in their personal information and choose a username and password to complete the registration process. All optional and required fields are presented in Figure 2‑2.
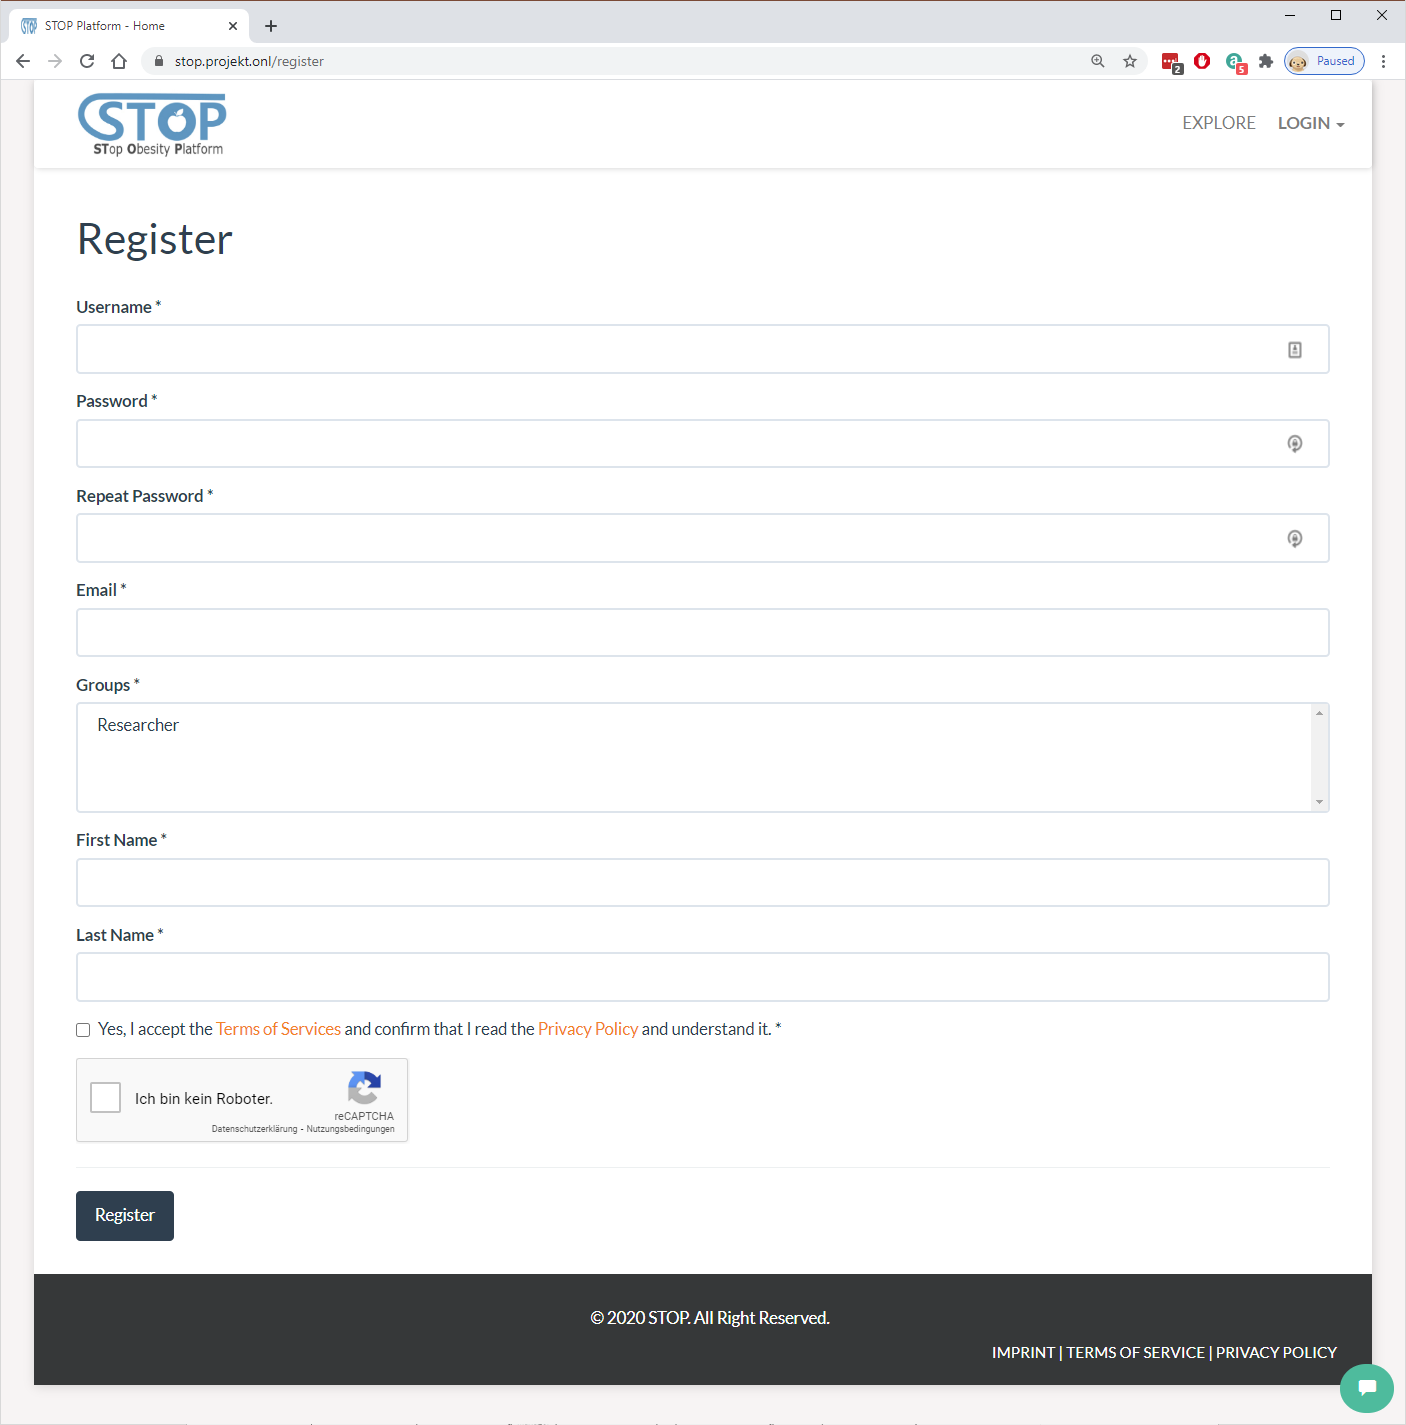
Figure ‑: User registration form
Fitness Overview
After completed registration and login using username and password, users are required to create a fitness profile. This step is needed for the system to calculate a personalized fitness plan for each user (Figure 2‑3).

Figure ‑: Create a fitness profile
The fitness profile also requires user’s current weight. The current weight could be added through the form shown in Figure 2‑4.

After the fitness profile was created, user can edit it by going to menu Fitness > Overview on the navigation bar. Figure 2-5 shows the editing form.
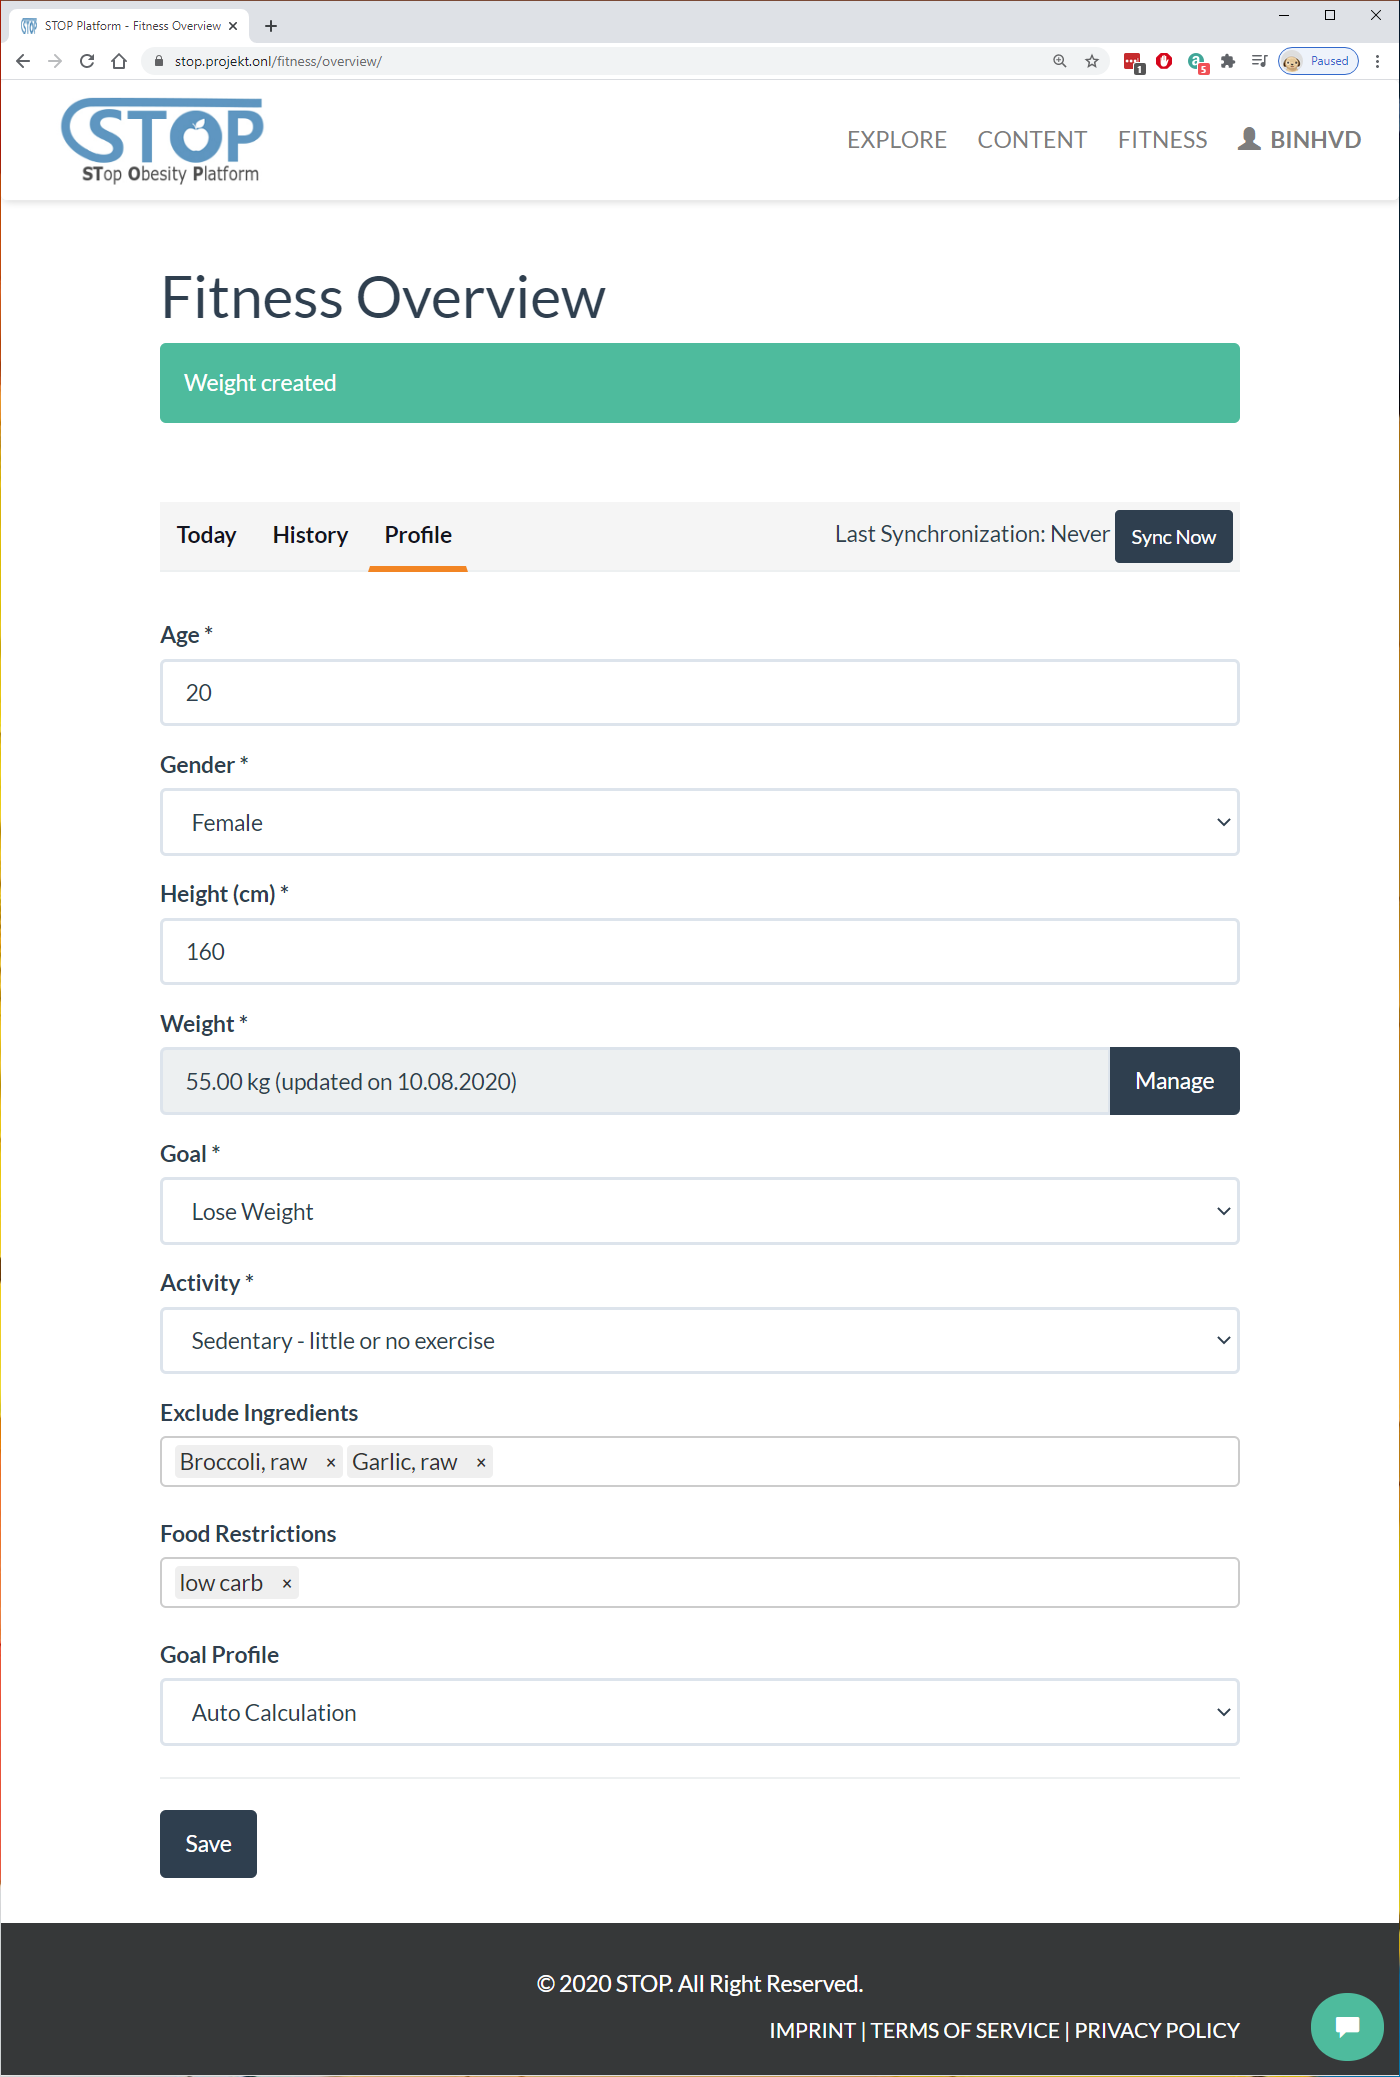
Figure 2‑5: Edit fitness profile
Fitness Data Importing
Users have the possibility to import their fitness data from a wearable device. By going to menu Fitness > Synchronize > Fitbit, users can access and import data from any Fitbit device (Figure 2-6).

Figure 2‑6: Import from Fitbit
Users will need to authorize the STOP portal to access their fitness data by logging in using their Fitbit account. Figure 2-7 presents Fitbit’s login interface.
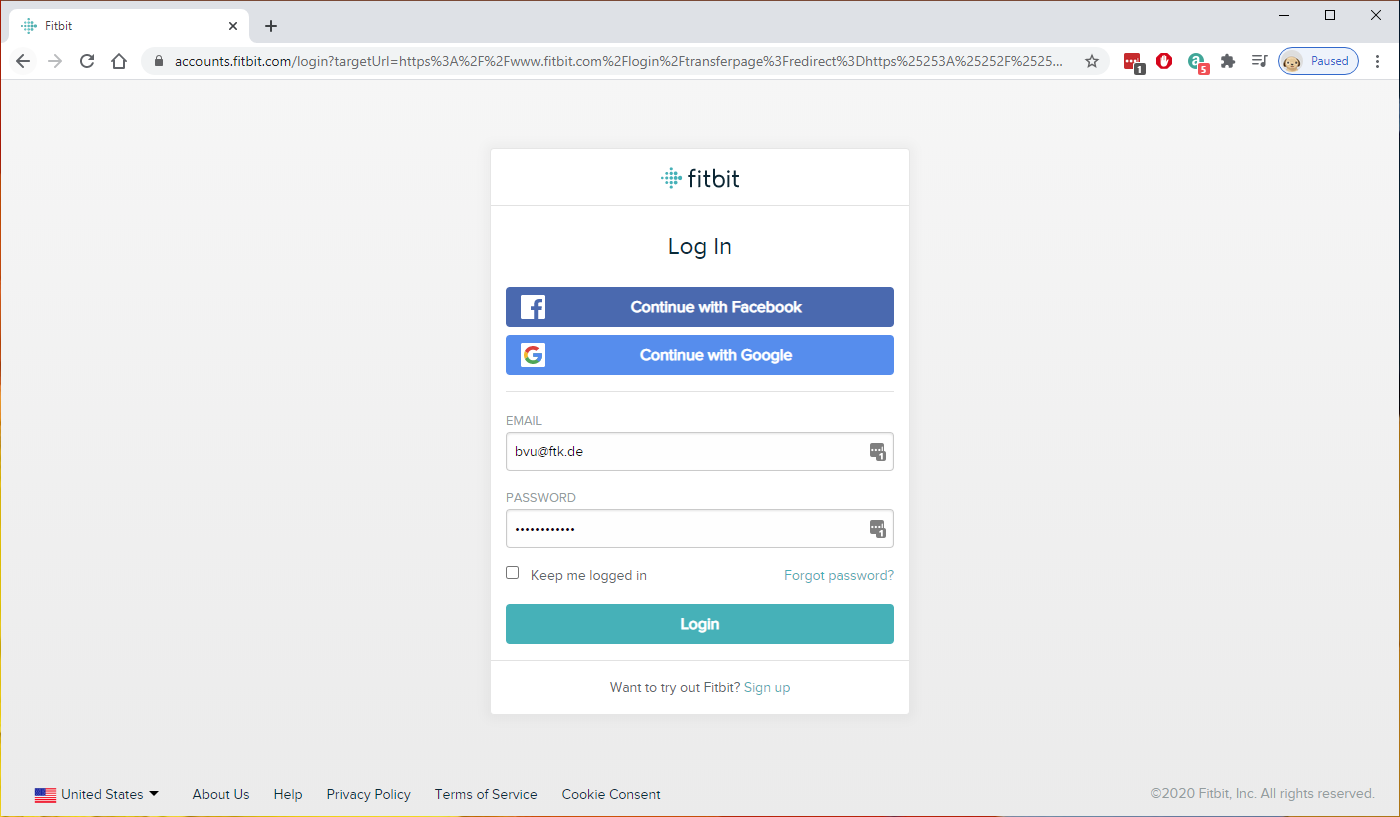
Figure 2‑7: Login Fitbit account
After authorized the STOP portal, users will be redirected back to the portal. Here, they can choose to access to new data created since the last import. If users haven’t import data from this service before, the system will suggest to load all data created from the last 3 months.
Users have the option to change the import date then click on the “Load New Records” button to download their fitness data (Figure 2-8).

Figure 2‑8: Load data from Fitbit
After loading fitness data from Fitbit, users can preview them. There are 6 types of fitness data loaded: Activities, Exercises, Weights, Foods, Waters, and Goals. As shown in Figure 2-9, users can click on the “Activities” tabs to browse the activity records. They can also search for specific record by using the search box.
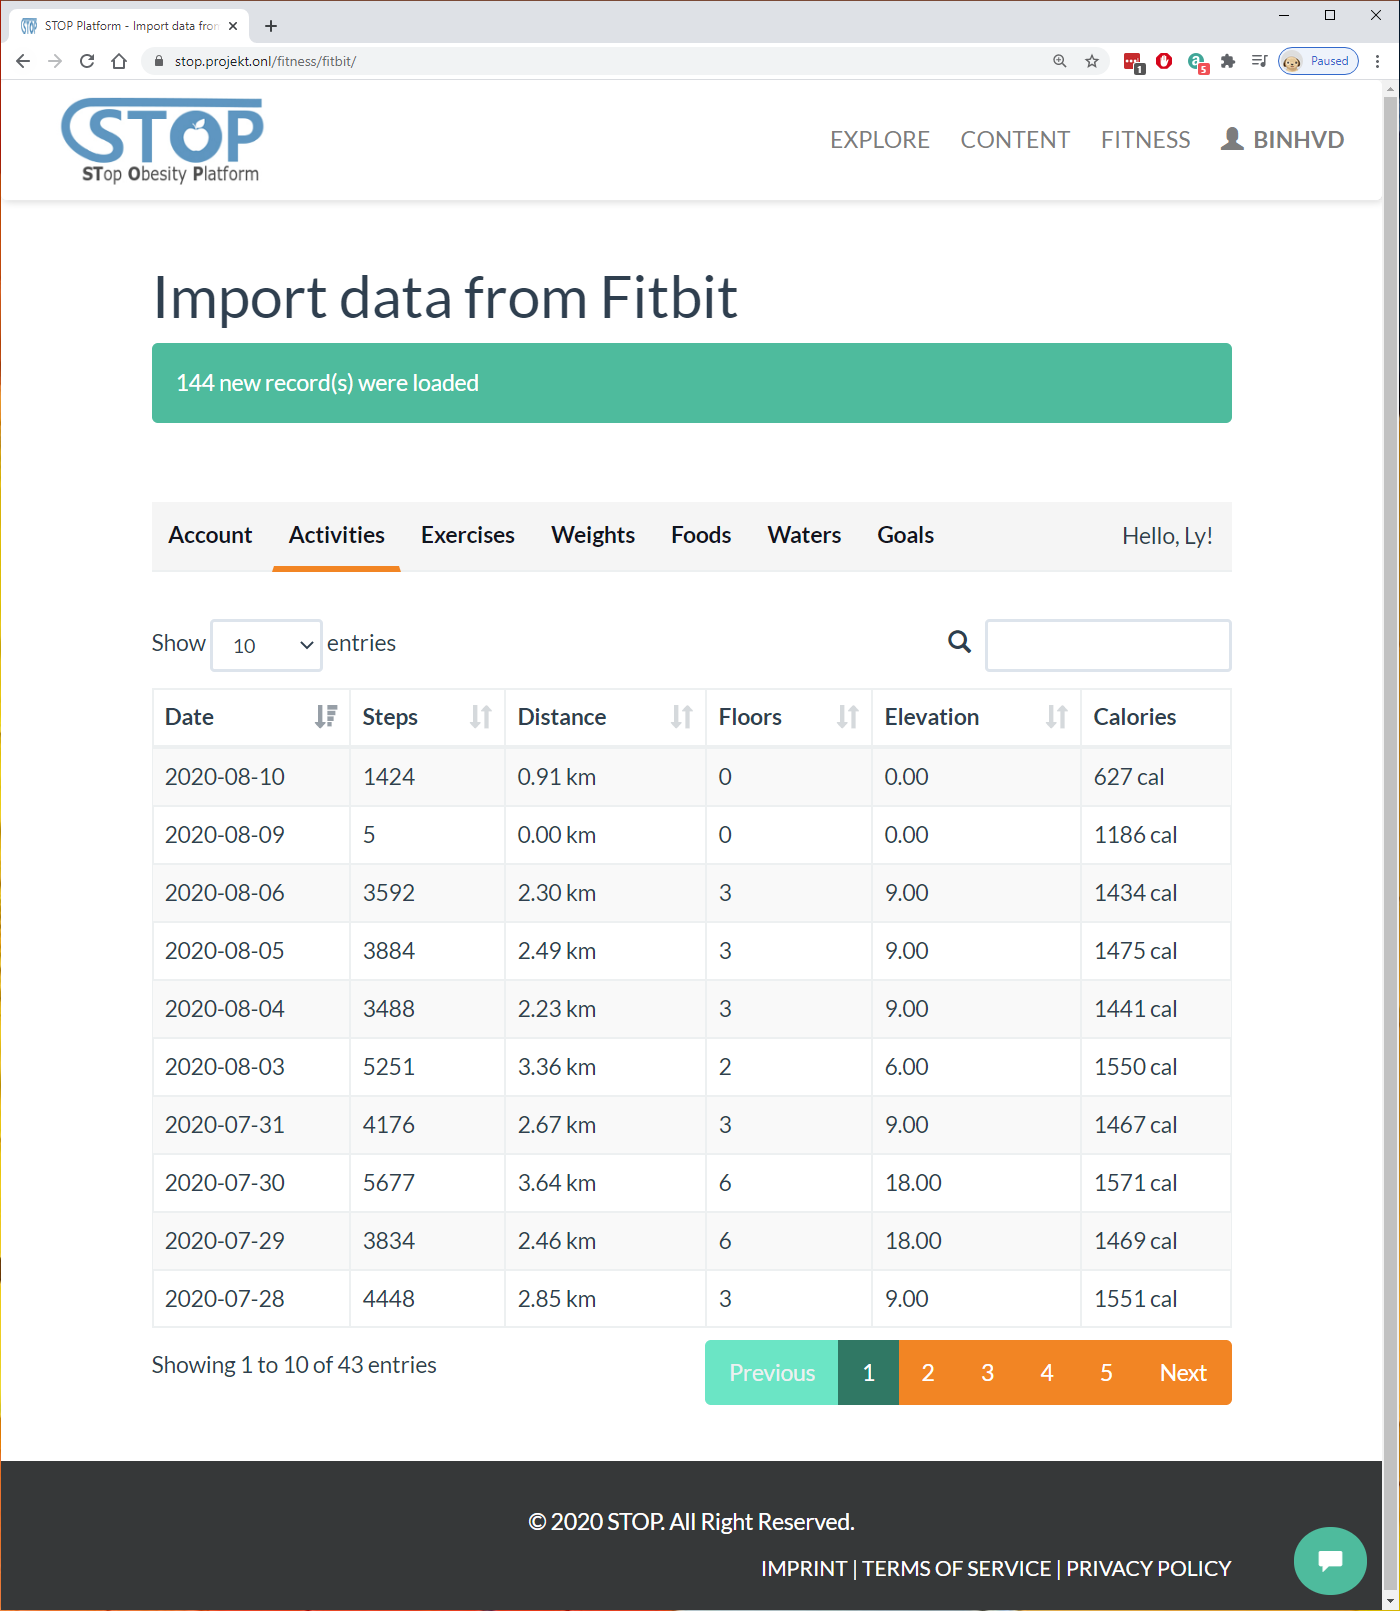
Figure 2‑9: List loaded activities
Similar to activity, users can browse exercise records in the “Exercises” tab. The related data for each exercise is shown in Figure 2-10.

Figure 2‑10: List loaded exercises
Users can look at their weight-related data each day in the “Weights” tab as shown in Figure 2-11.

Figure 2‑11: List loaded weights
If users enter their food consumption, such as food name, consumption time… to their Fitbit account, it will be listed in the “Foods” tab (Figure 2-12).
The same applies to water. It will show how much water user drank each day.

Figure 2‑12: List loaded foods
Finally, the last tab shows the target users added or calculated by Fitbit based on the users’ fitness profile (Figure 2-13).
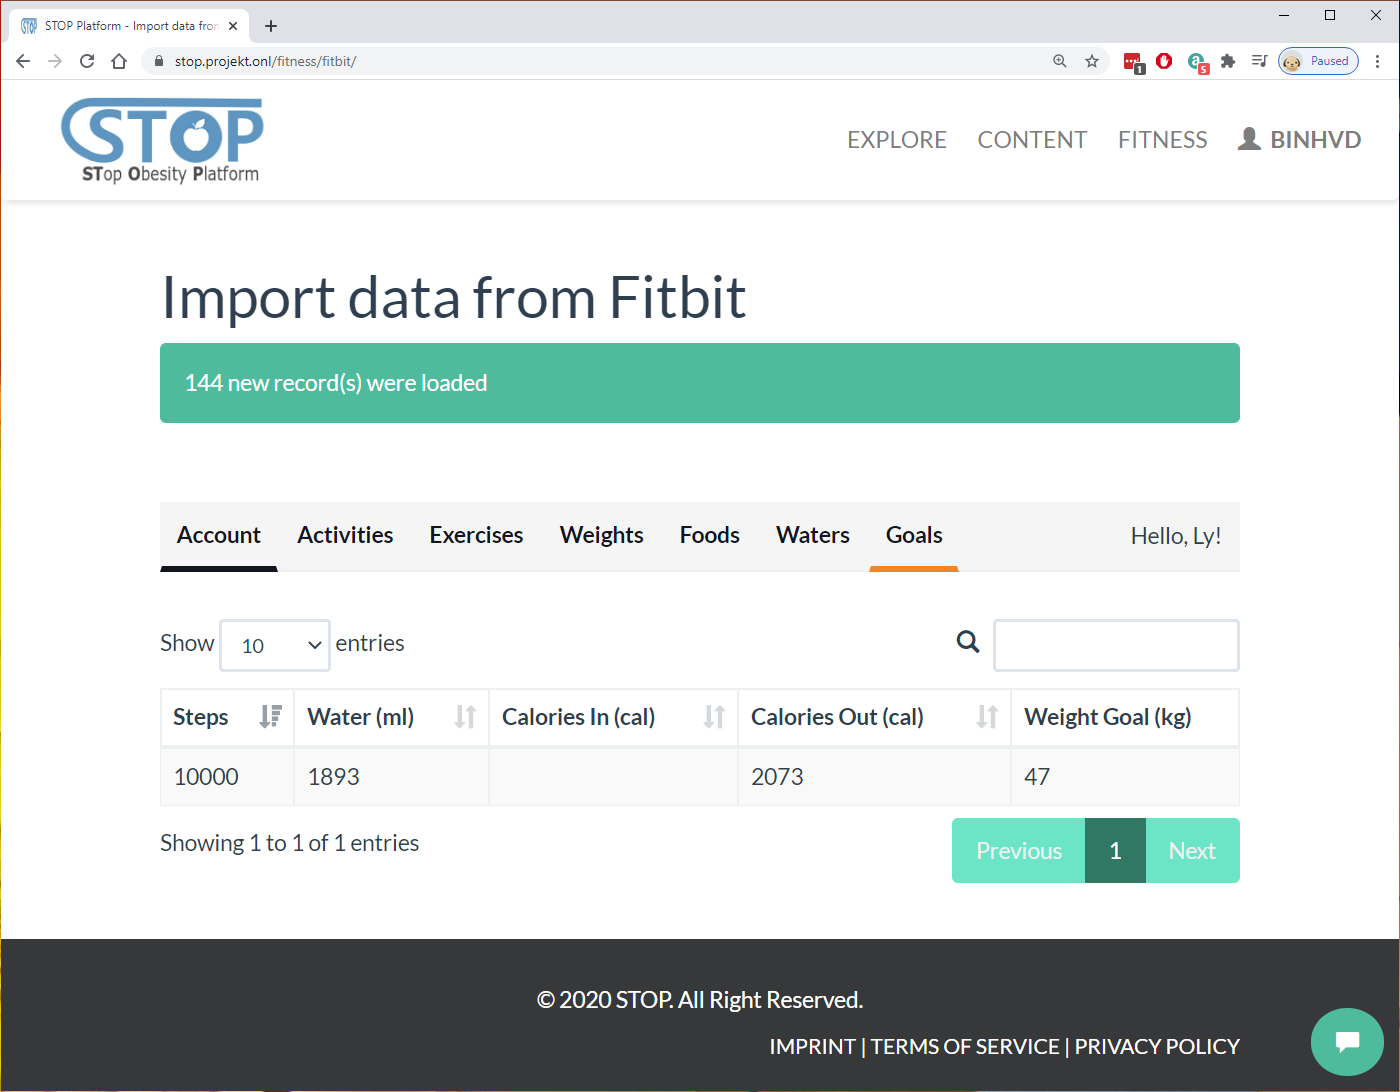
Figure 2‑13: List loaded goals
After viewing all their data, users click on “Synchronize” button at the end to import them to the STOP portal. The system will show how many records were imported successfully as in Figure 2-14.

Figure 2‑14: Import data successfully
Activity Manager
After fitness data was imported, users can manage their data in the “Fitness” menu. To manage activity data, users can go to Fitness > Activities menu. In Figure 2-15, all activity records are listed. Users can either edit existing records by clicking on “Edit” button or create a new activity by clicking on “Add Activity”.

Figure 2‑15: List created activities
In the “Add/Edit Activity” page as shown in Figure 2-16, users need to fill out the required fields, such as “Log Date”. Other fields, such as “Log Time”, “Distance”, “Steps”, are optional. After filling out all the information, users click on “Create/Save” to create a new activity or save the edited record. Furthermore, users can also click on “Cancel” button to come back to the listing page.

Figure 2‑16: Edit an activity
On the listing page, users click on the “Delete” button of a record to remove this record from the database. The system will ask for users’ confirmation to make sure that they have not clicked on this button by mistake (Figure 2-17).

Figure 2‑17: Delete an activity
Exercise Manager
Next to “Activities” menu is the “Exercises” menu, where users can manage their exercise records (Figure 2-18). Similar to “Activities”, users can click on “Edit” button to edit existing record or “Add Exercise” button to create a new exercise.

Figure 2‑18: List created exercises
In the “Add/Edit Exercise” page shown in Figure 2-19, users will need to fill out the information related to their exercise, such as name, date, description, distance, etc. After completed this step, users click on the “Create/Save” button to save the input to the database. Users can stop this process and go back to the listing page anytime by clicking on the “Cancel” button.

Figure 2‑19: Edit an exercise
On the listing page, users can delete a record by clicking on the “Delete” button at the end of the row. Figure 2-20 shows the system asking users once more time before removing the record from the database.

Figure 2‑20: Delete an exercise
Meal Manager
Users can manage their food consumption by selecting Fitness > Meals menu (Figure 2-21). Here they can ask the system to suggest a recipe for their next meal or add a meal that they just ate. Furthermore, users can edit the created record in the list.

Figure 2‑21: List created meals
In the “Add/Edit Meal” page in Figure 2-22, users will need to add the food they ate in the meal then click on the “Create/Save” button to save the input to the database. Otherwise, users can stop this process and go back to the listing page anytime by clicking on the “Cancel” button.

Figure 2‑22: Add a meal
Similar to other type of data, users can delete a meal record by clicking on the “Delete” button at the end of the row. The system will need users’ confirmation once more time before removing the record from the database as shown in Figure 2-23.

Figure 2‑23: Delete a meal
Water Consumption Manager
Users can manage their water consumption by selecting Fitness > Water menu. Here they can add a drink record to the system or edit the added drink in the list shown in Figure 2-24.
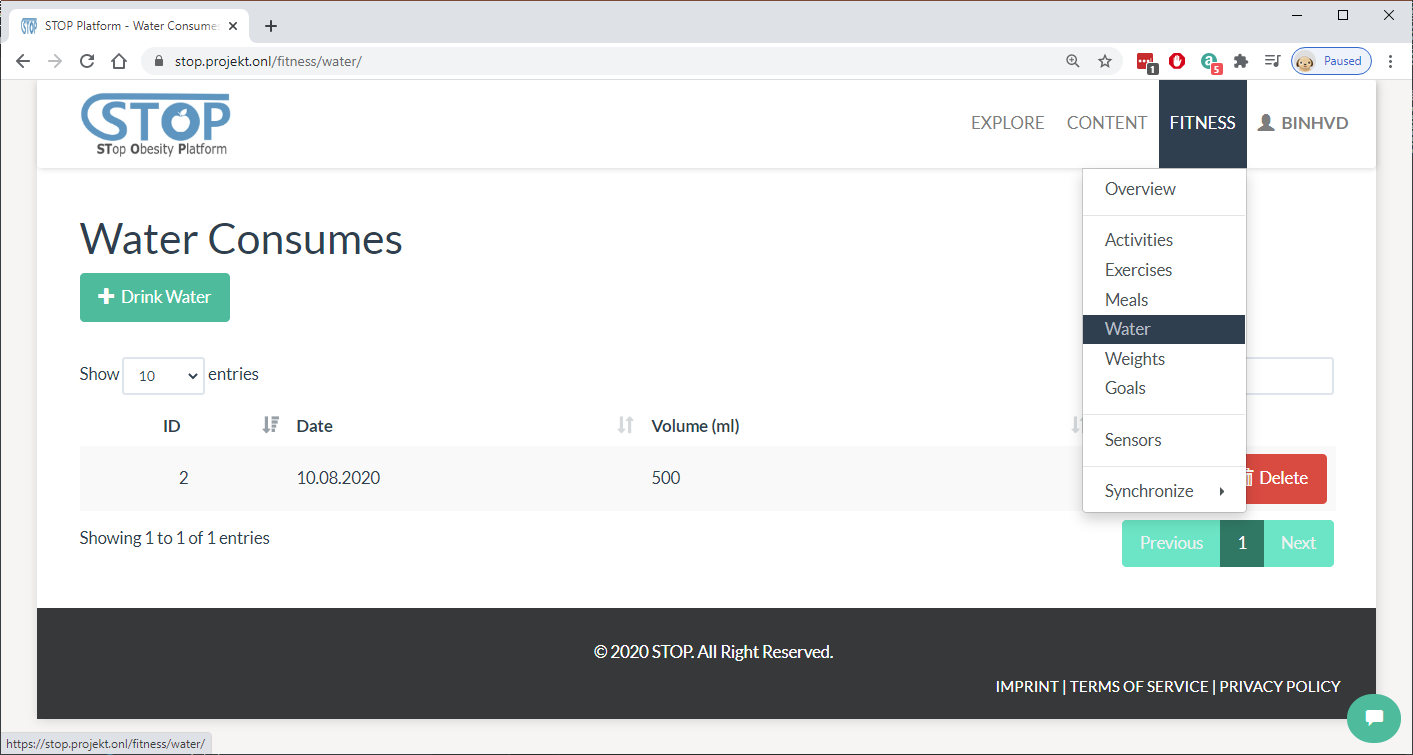
Figure 2‑24: List created water consumptions
In the “Add/Drink Water” page as shown in Figure 2-25, users fill out the timestamp and volume of the drink then click on the “Create/Save” button to save it to the database. Otherwise, users can stop this process and go back to the listing page anytime by clicking on the “Cancel” button.

Figure 2‑25: Drink water
In the listing page, users can delete a drink by clicking on the “Delete” button at the end of the row. The system will ask users if they are sure before removing the drink from the database (Figure 2-26).

Figure 2‑26: Delete a water consumption
Weight Manager
In the Fitness > Weights menu, users can manage the changes of their weight over time. Here they can add, edit, or delete their weight records. Figure 2-27 shows the list of user’s weight records.
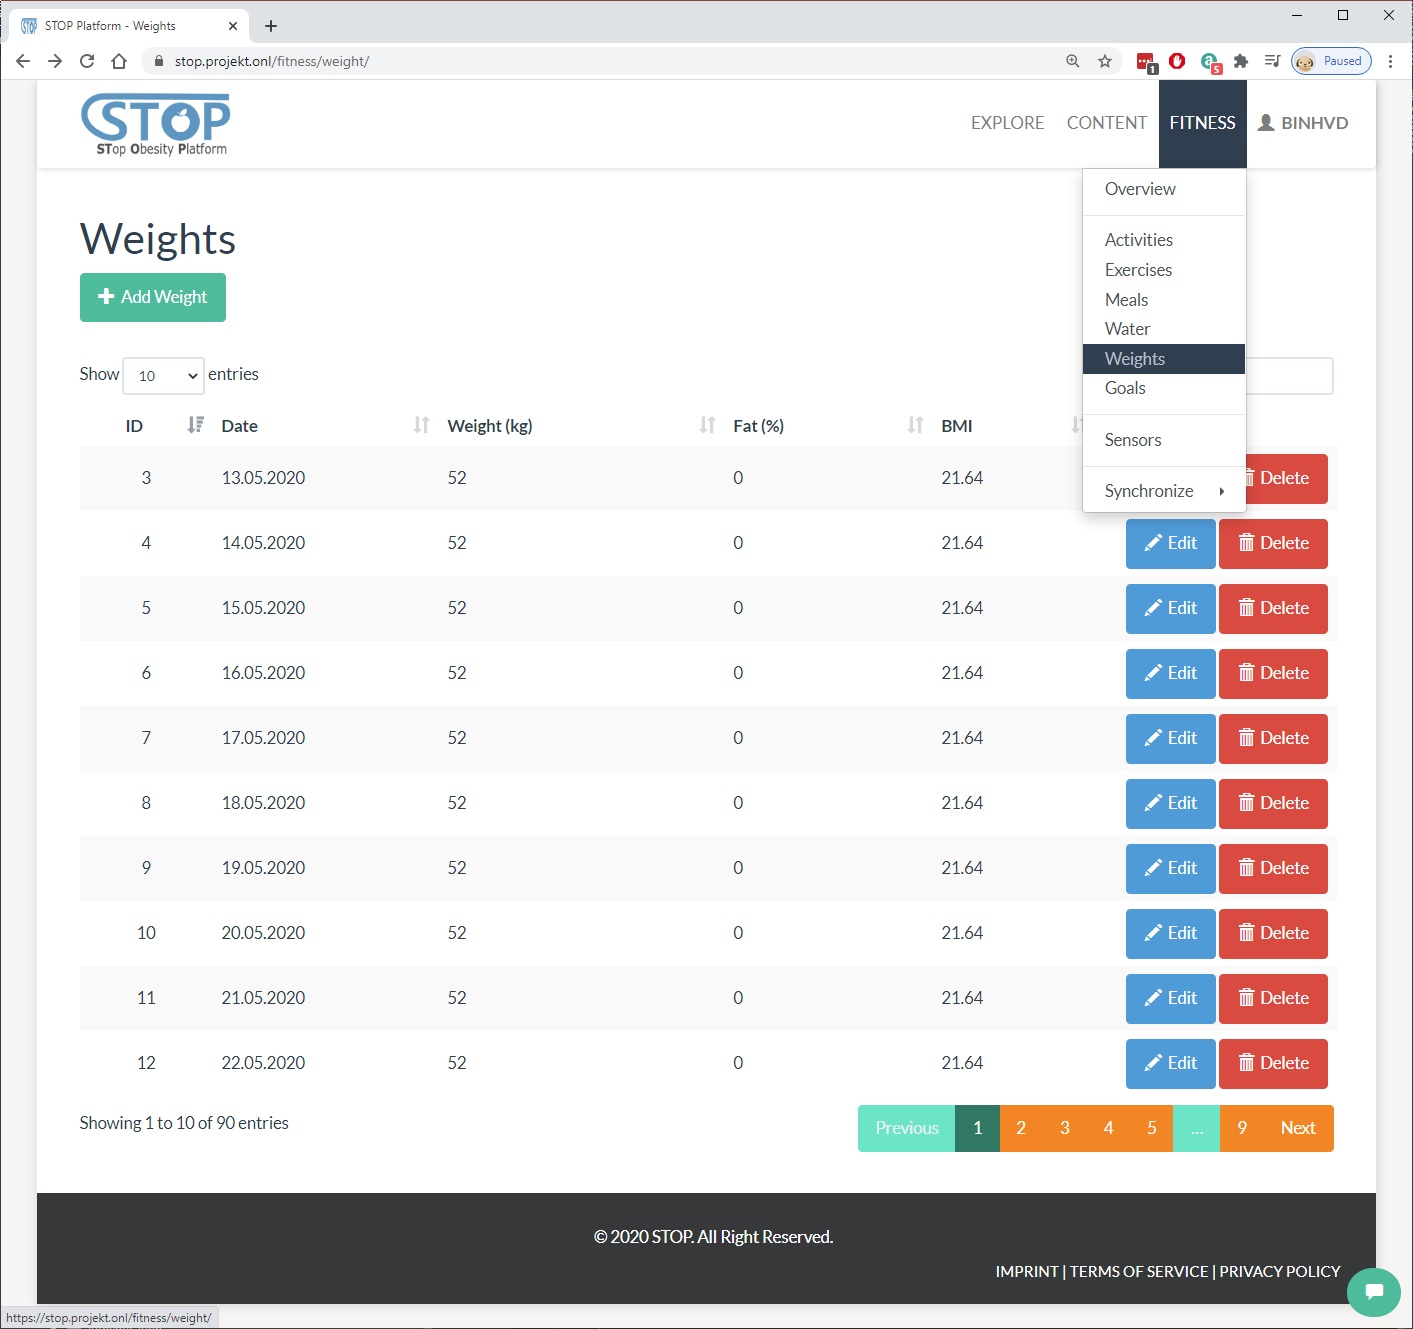
Figure 2‑27: List created weight records
In the “Add/Edit Weight” page in Figure 2-28, users type in their weight along with BMI and Fat value then click on the “Create/Save” button to save them to the database. Users can also click on the “Cancel” button to stop this process and go back to the listing page.

Figure 2‑28: Add a weight record
In the listing page presented in Figure 2-29, users can delete a record by clicking on the “Delete” button at the end of each row. The system will ask users if they are sure before removing the record from the database.

Figure 2‑29: Delete a weight record
Goal Manager
Finally, users can manage their fitness goals by going to the Fitness > Goals menu. Here, goals imported from fitness services and created by the users in the portal are listed. Users can create, edit, or delete them from the database as illustrated in Figure 2-30.

Figure 2‑30: List created goals
In the listing page, users can delete a goal by clicking on the “Delete” button at the end of each row. Figure 2-31 shows the system asking users if they are sure before removing the goal from the database.
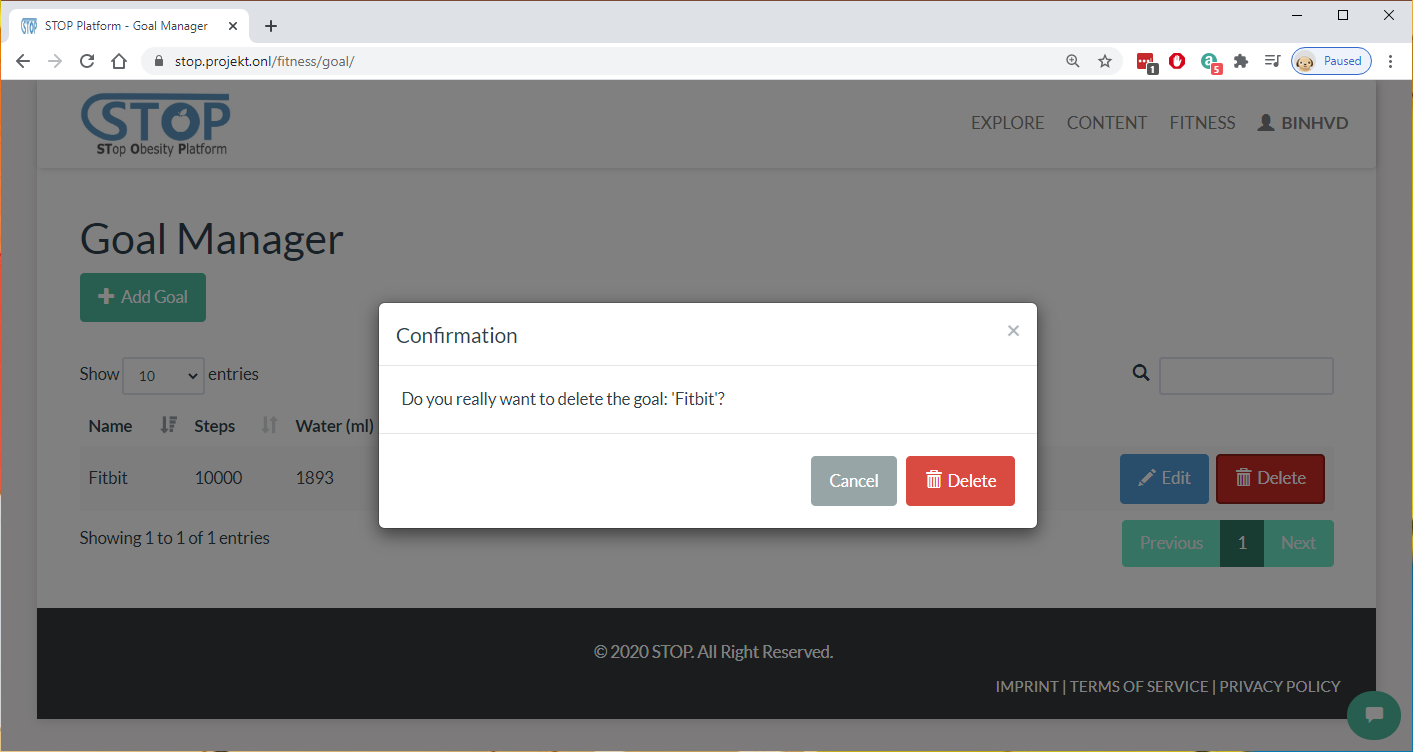
Figure 2‑31: Delete a goal entry
After clicking on “Edit” or “Add Goal” button, users will be directed to the “Add/Edit Goal” page. Here, users fill out the needed information then click on the “Create/Save” button to save them to the database. Furthermore, users can click on the “Cancel” button to go back to the listing page as shown in Figure 2-32.

Figure 2‑32: Edit a goal entry
After new goals were created, users can select between them and “Auto Calculation” in the Fitness Profile anytime (Figure 2-33). This will change the user’s target for each day in the Fitness Overview visualization.
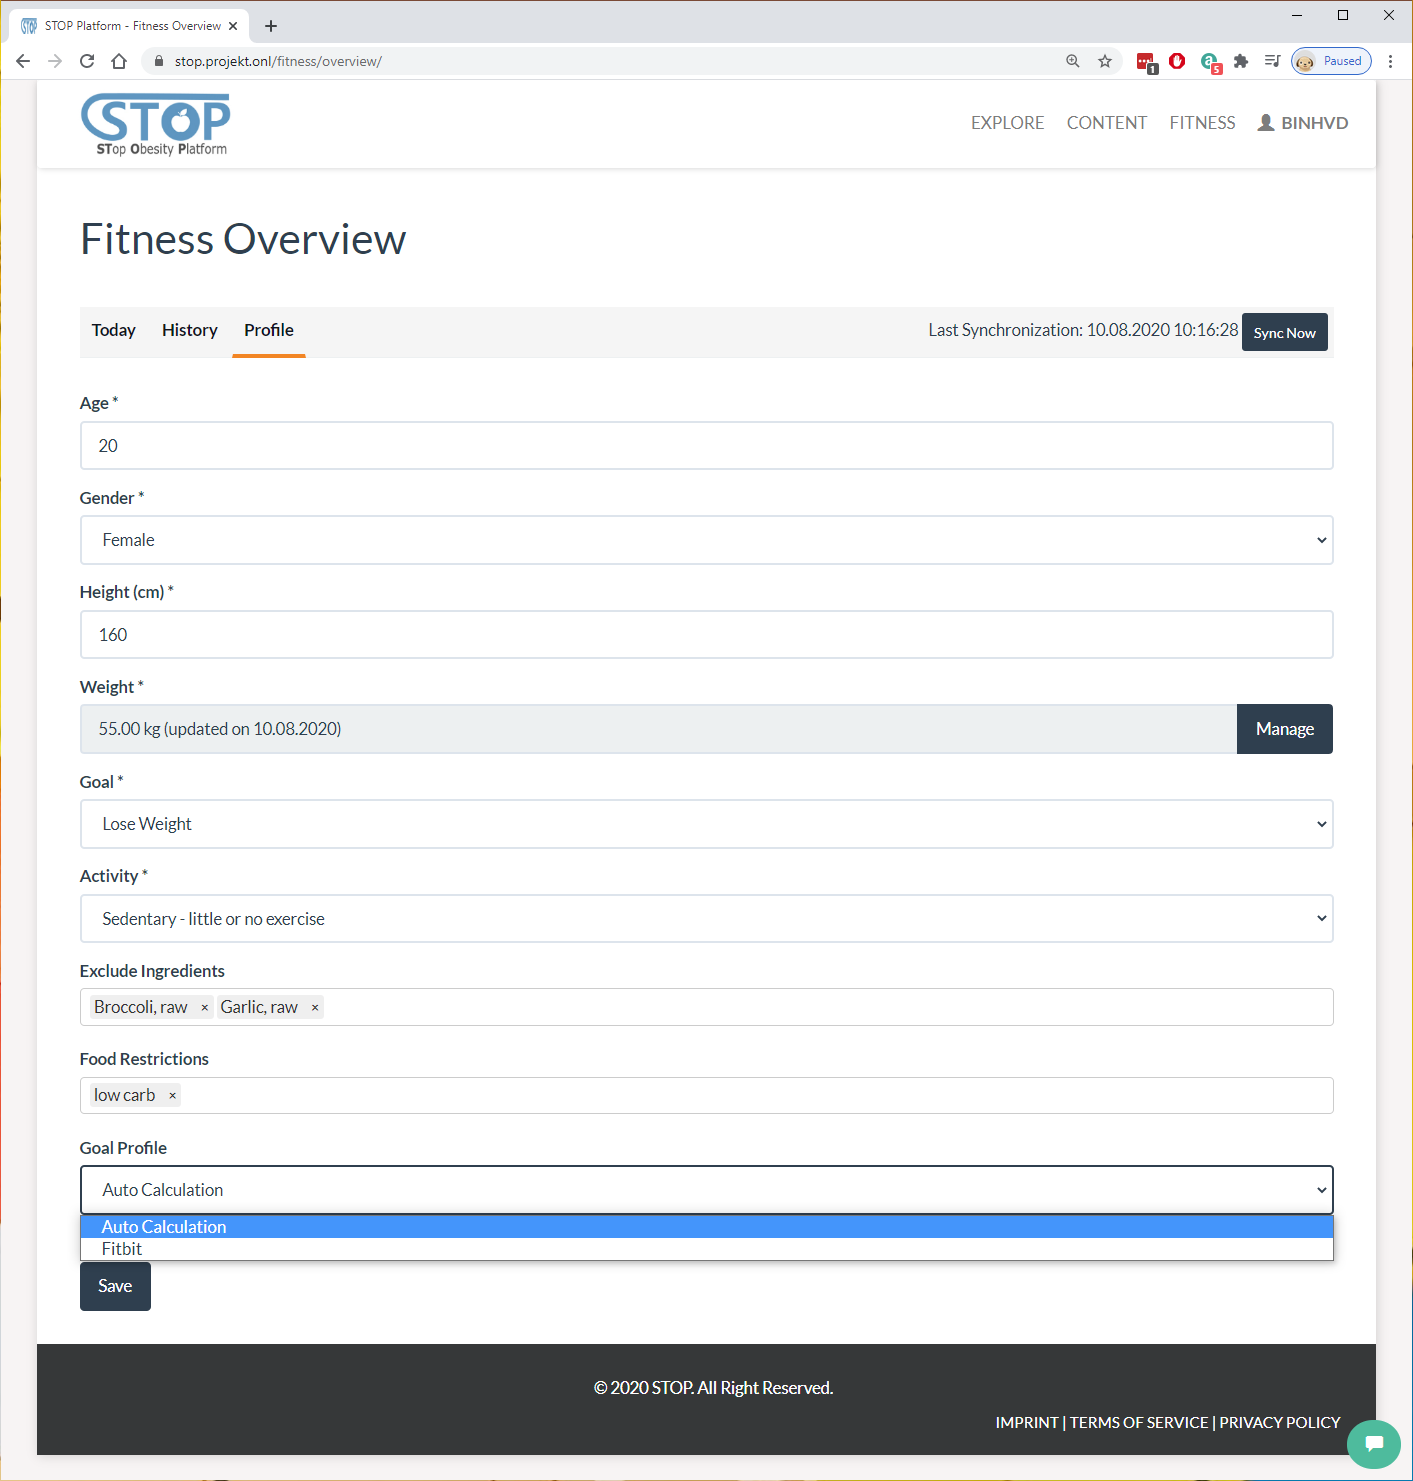
Figure 2‑33: Change goal profile
Knowledge Management
This system manages all content and knowledge in the STOP portal. New content and knowledge can either be created by the users or imported from external files and services.
Publication Manager
Users can manage publications in the Content > Publication menu. Here, they can create, edit, and delete publication records in the database. Users can also view a publication by clicking on its title. Figure 2-34 shown the management page.

Figure 2‑34: List created publications
In the Adding/Editing page in Figure 2-35, users need to fill out the metadata for the publication. The metadata is split into several groups, such as authors, identifiers, publishers, etc. In “Multimedia” group, users are able to upload and manage PDF files for the publication.

Figure 2‑35: Edit a publication
In the listing page, users can delete a publication by clicking on the “Delete” button at the end of each row. The system will ask users if they are sure before removing the publication from the database (Figure 2-26).

Figure 2‑36: Delete a publication
In figure 2-37, the “Content Display” page shows the metadata and download a publication. Here, users can view related information such as title, authors, description, etc. Furthermore, they can rate the quality of the publication as well as share it on the social networks.

Figure 2‑37: View a publication
Multimedia Manager
Users can manage multimedia in the STOP portal by selecting the Content > Multimedia menu. Figure 2-38 illustrates the record list. Here, they can create, edit, and delete multimedia records in the portal. Users can also view a multimedia’s metadata and download it by clicking on its title in the listing table.
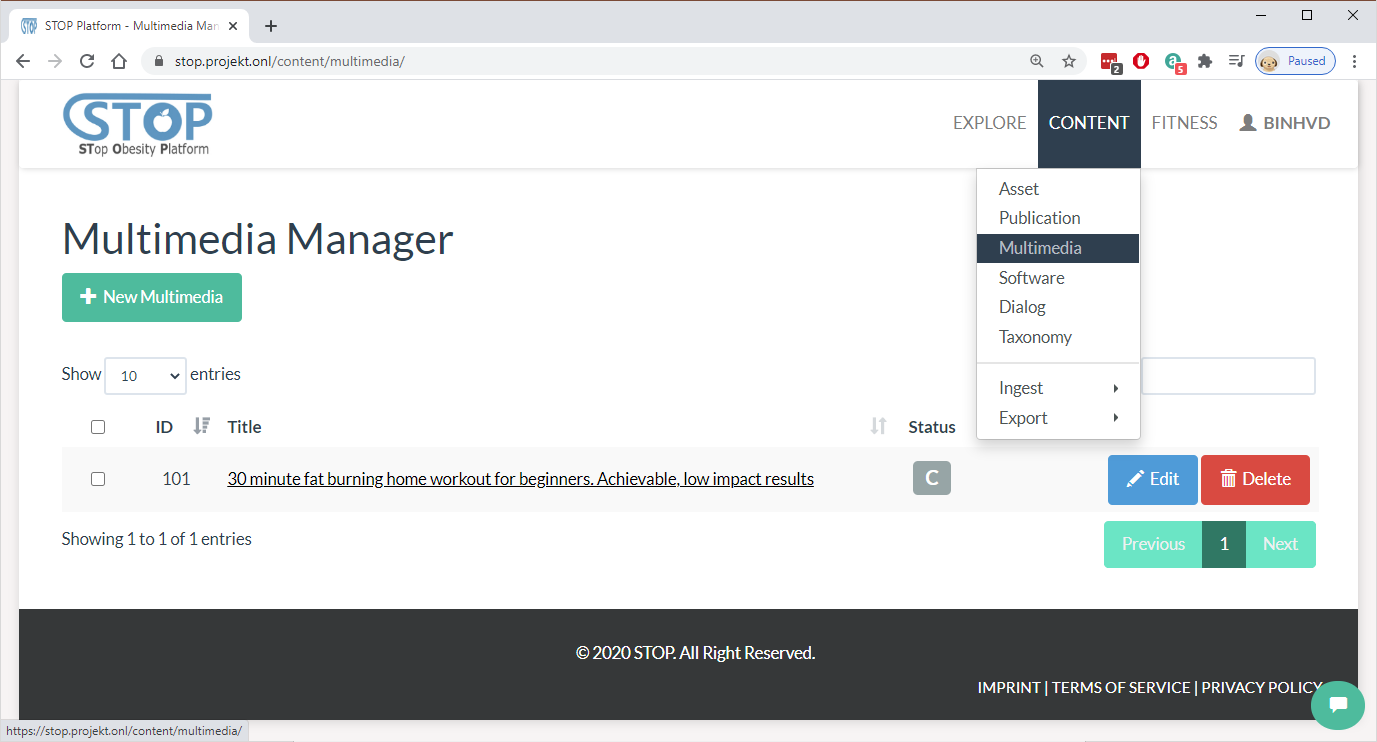
Figure 2‑38: List created multimedia
After clicking on the “New Multimedia” or “Edit” button, users are directed into the “New/Edit Multimedia” page as shown in Figure 2-39. Similar to Publication, users need to fill out multimedia metadata and upload data here. There are different types of multimedia, such as video, presentation, audio, zip. Depend on the multimedia type, users will be able to upload different data.

Figure 2‑39: Edit a multimedia
In the listing page, users can delete a publication by clicking on the “Delete” button at the end of each row. Figure 2-40 shows the system asking users if they are sure before removing the publication from the database.

Figure 2‑40: Delete a multimedia
Users are able to look at a multimedia metadata and download or play it content in the “Content Display” page as presented in Figure 2-41. Here, users can read important information such as multimedia title, description, authors, etc. Furthermore, they can also rate this content and share it on different social networks.

Figure 2‑41: View a multimedia
Taxonomy Manager
Taxonomy is an important type of content that allows users to use it to classify content in the STOP portal. To manage taxonomies, users need to go to the Content > Taxonomy menu. In figure 2-42, taxonomies created by the users are listed for viewing, editing, and deleting. Furthermore, users can create new taxonomy by clicking on the “New Taxonomy” button.

Figure 2‑42: List created taxonomies
In the “New/Edit Taxonomy” page, users are able to create a new taxonomy or edit an exiting taxonomy (Figure 2-43). Users will need to fill out the related information such as taxonomy title, keywords, description, and authors. In the “Structure” tab, users are provided with a taxonomy building tool that supports user in the construction and management of a taxonomy.

Figure 2‑43: Edit a taxonomy
In the listing page, users can delete a publication by clicking on the “Delete” button at the end of each row. The system will ask users if they are sure before removing the publication from the database. Figure 2-44 presents the deleting page.
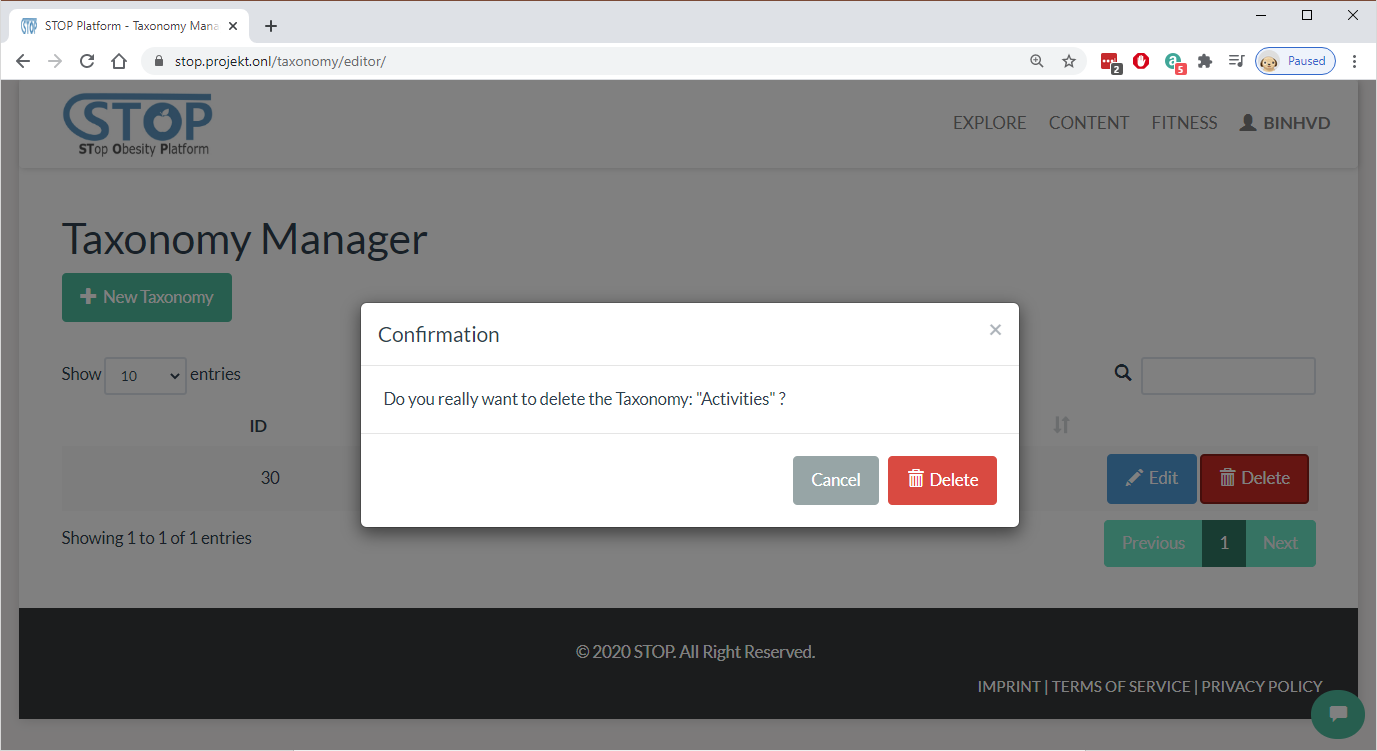
Figure 2‑44: Delete a taxonomy
Figure 2-45 presents the “Taxonomy Display” page, where users can view the metadata of a taxonomy, its structure, and are able to export it into different formats. Similar to publication and multimedia, users can see the current rating of the viewing taxonomy and rate it by selecting the stars in the top of the page. They are also able share the content on social networks. In the right panel, the system will suggest content that is similar to the viewing taxonomy.
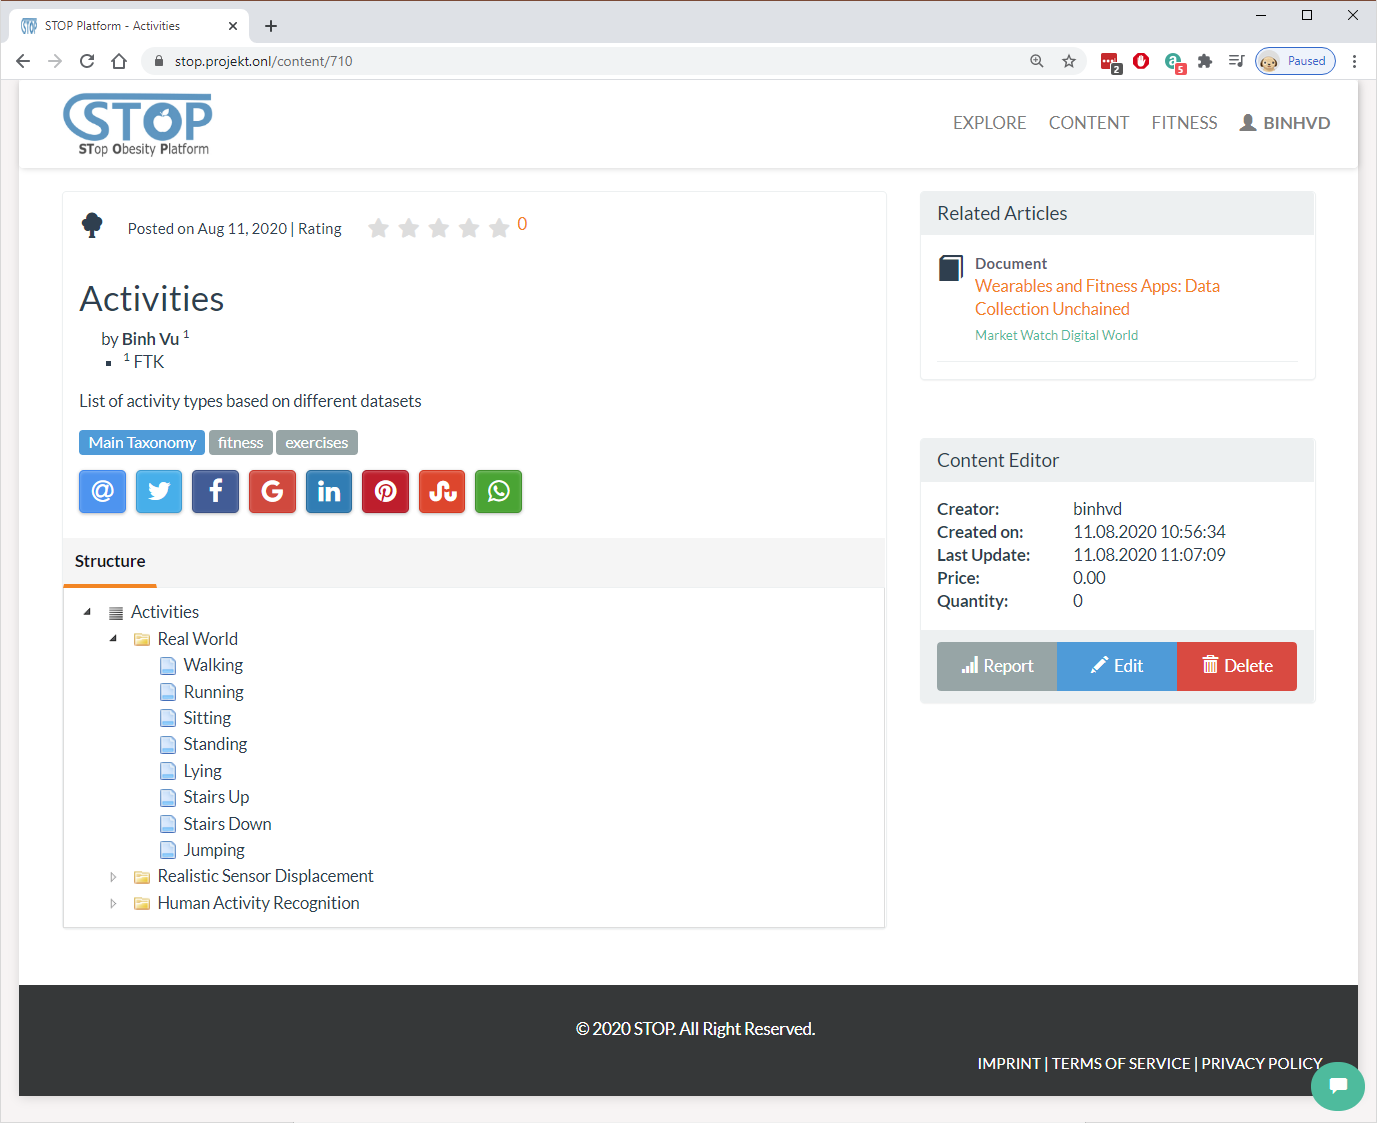
Figure 2‑45: View a taxonomy
Content and Knowledge Importing
Content can be imported from different formats, such as BibTex and OAI-PMH, and external services, such as Mendeley, SlideShare, GibHub, StackExchange, DSpace, and Youtube, to the STOP portal. To do so, users need to go to the Content > Ingest menu. Here, they can select one of the services to start the import process (Figure 2-46).

Figure 2‑46: Import a question from StackExchange
After choosing the content that needs to be imported, the system will direct users to the Import Wrapper Manager (Figure 2-47). It is where the mapping table, which tells the import system which fields from the external service can be copied to which fields in the STOP database, is managed. Here, users can change, delete, import, and export the mapping setting. After making sure the mapping is correct, users click on the “Import” button to start the importing process.

Figure 2‑47: Edit StackExchange’s wrapper
Dialog Manager
Dialog (questions and answers) can be imported from the StackExchange service. After that, they can be managed in the Content > Dialog menu. Here, users can create new dialog, edit existing records, or delete them as presented in Figure 2-48. Users can also read a dialog by clicking on its title or search for dialogs using the searching box.
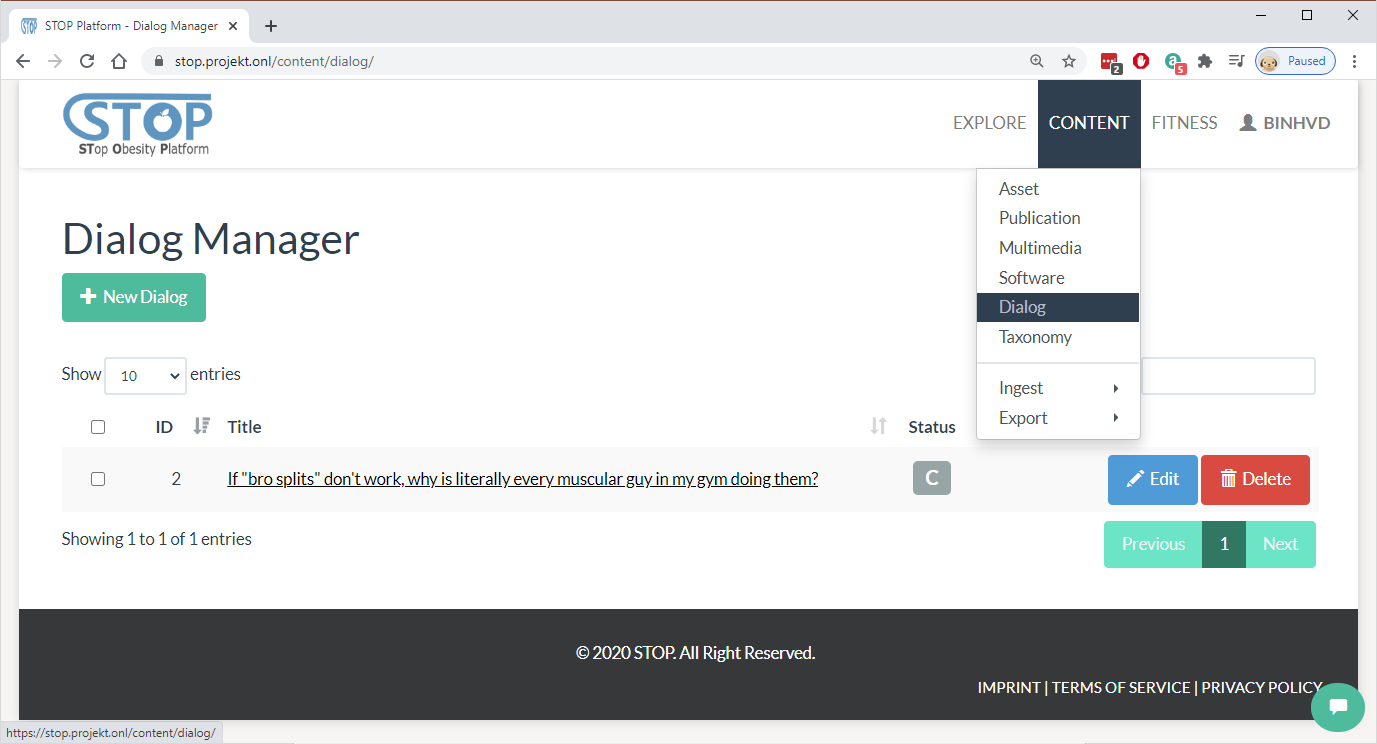
Figure 2‑48: List created dialogs
Figure 2-49 shows the “New/Edit Dialog”, where users can create/edit a question by entering its title, keywords, and content. The system allows some forms of simple HTML, such as p, li, strong, etc. Users click on the “Save” button to complete the creating/editing or the “Cancel” button to stop the process and go back to the listing page.

Figure 2‑49: Edit a dialog
In the listing page, users can delete a dialog by clicking on the “Delete” button at the end of each row. Figure 2-50 illustrates the final step where the system asking users if they are sure before removing the dialog from the list.
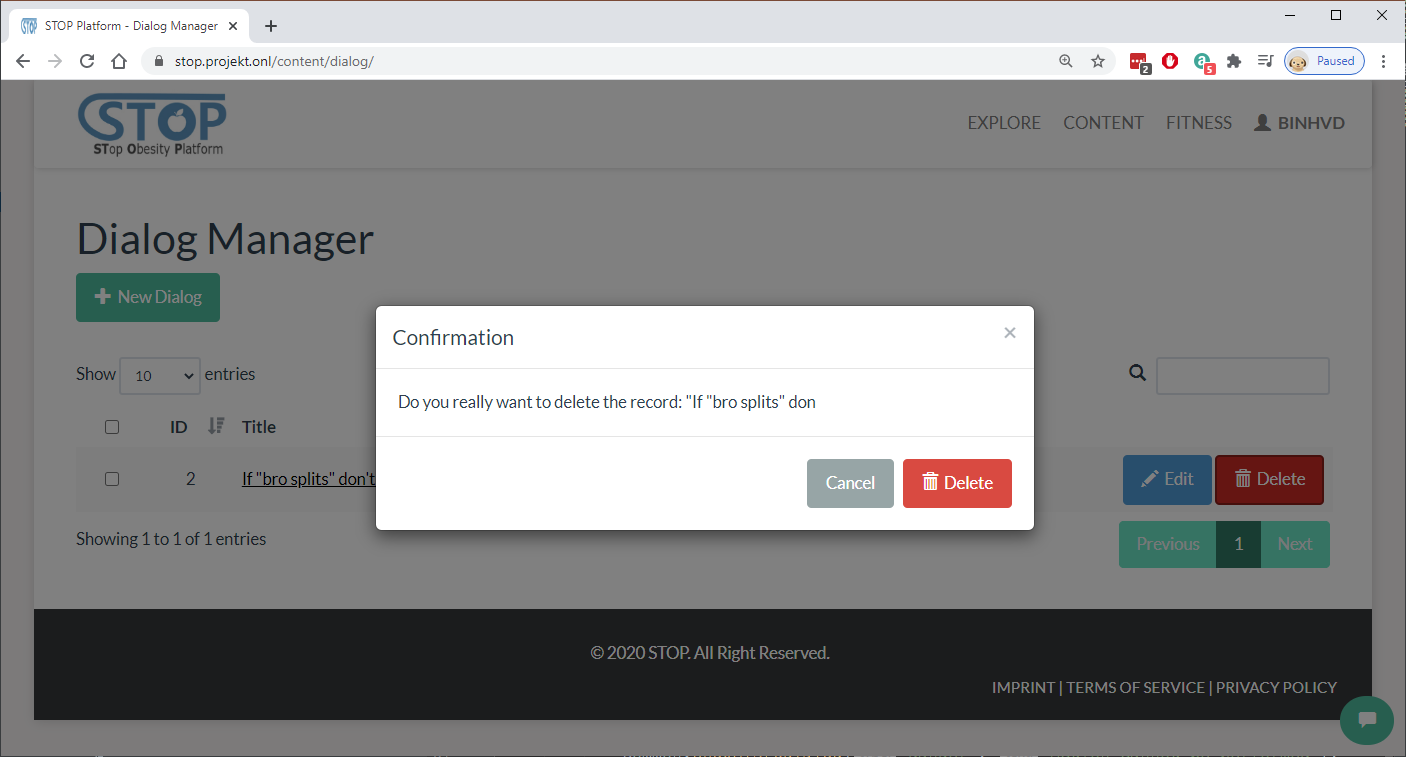
Figure 2‑50: Delete a dialog
In Figure 2-51, users can look at the questions and answers of a dialog. They can also see the upvotes for each answer and the question itself. Furthermore, users have the option to upvote or downvote an answer and the question. The timestamp and author of each answer and question are also displayed for the viewer. Finally, users can provide their answers for the posted question.

Figure 2‑51: View a dialog
Content and Knowledge Searching
Content in the STOP portal is categorized and can be searched by the users. The searching page can be reached by clicking on the “Explore” menu. As present in Figure 2-52, users can enter the searching term then clicking on the “Search” button to start the searching process. After the search result is presented to the users, they can apply filters, such as publication year, type of content, or categorization, for a narrower search result.

Figure 2‑52: Search for content
Sensory Data Fusion: Cognitive Walkthrough
In this section, the sensory Data Fusion developed in the STOP project is introduced. The system’s first release is presented in a cognitive walkthrough where its features and functionalities are described in a series of screenshots and descriptions.
Sensor Manager
Users can manage their sensors by going to the Fitness > Sensors menu. Here the list of all sensors is shown to the viewer (Figure 3-1). Simple information such as the ID of the sensors, their positions, and the number of datasets for each sensor are displayed. Users have the option to add new sensors, view their datasets, or delete sensors from the list.

Figure 3‑1: List created sensors
In the adding page, users need to choose the position of the new sensor then click on the “Create” button. They can also click on the “Cancel” button to cancel the process and go back to the listing page as shown in Figure 3-2.

Figure 3‑2: Add a new sensor
In the listing page, users can delete a sensor by clicking on the “Delete” button at the end of each row. The system will ask users if they are sure before removing the sensor from the list (Figure 3-3).

Figure 3‑3: Delete a sensor
Dataset Manager
In the dataset listing page presented in Figure 3-4, users can browse and search for datasets of a chosen sensor. The list shows all datasets belong to a sensor including their IDs, created dates, frequencies, and activities. Users have the option to add new datasets, view them, or delete them from the list.

Figure 3‑4: List all datasets of a sensor
In the adding page (Figure 3-5), users need to select dataset name, enter its frequency, and select the activity, which was recorded. The raw data in CSV format can be uploaded to the system using the upload field.
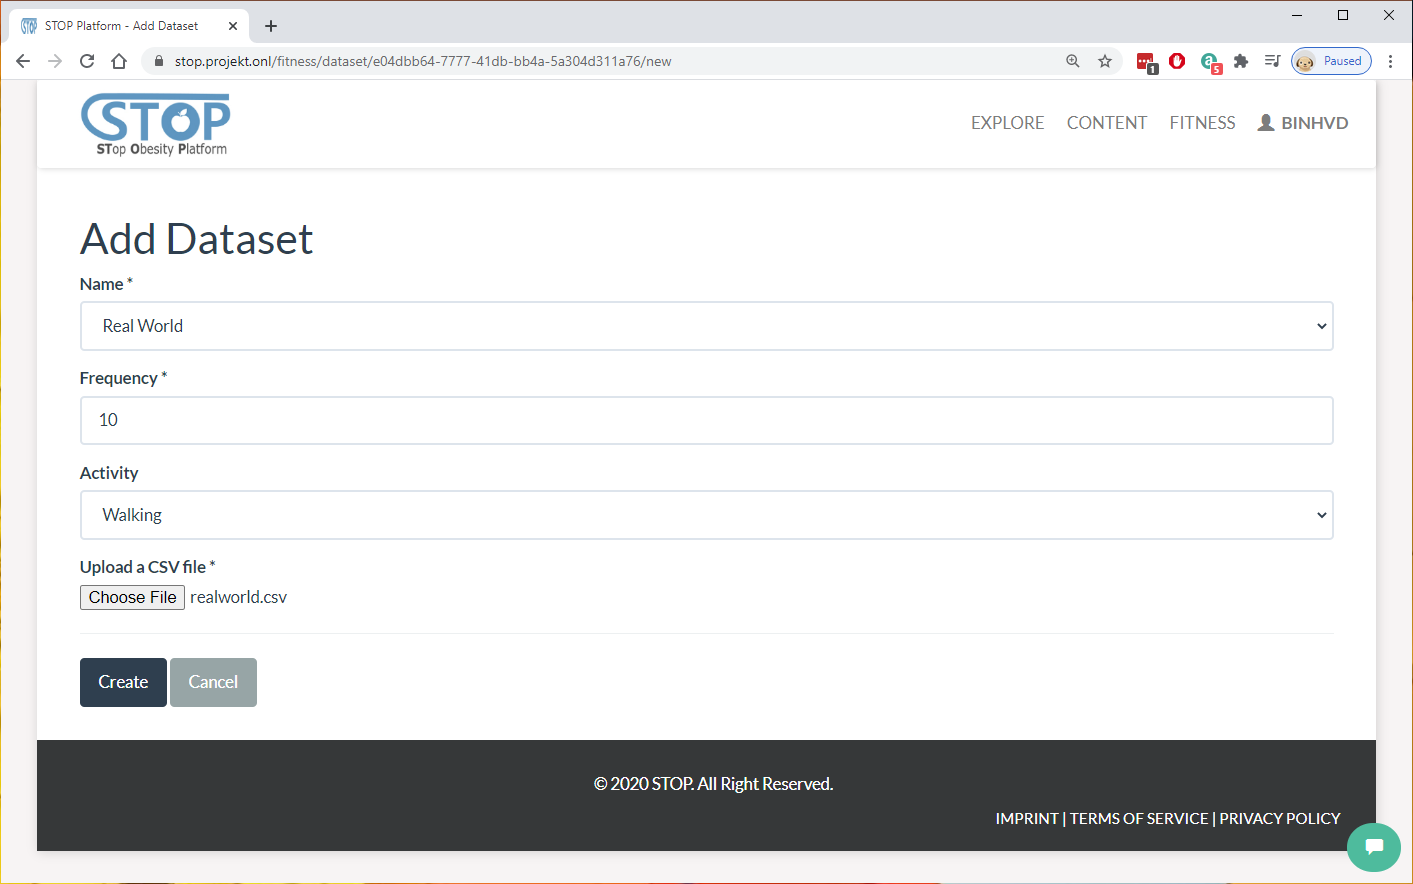
Figure 3‑5: Add a dataset
In the listing page, users can delete a dataset by clicking on the “Delete” button at the end of each row. Figure 3-6 presents the confirmation step where the system asks users if they are sure before removing the dataset from the sensor.
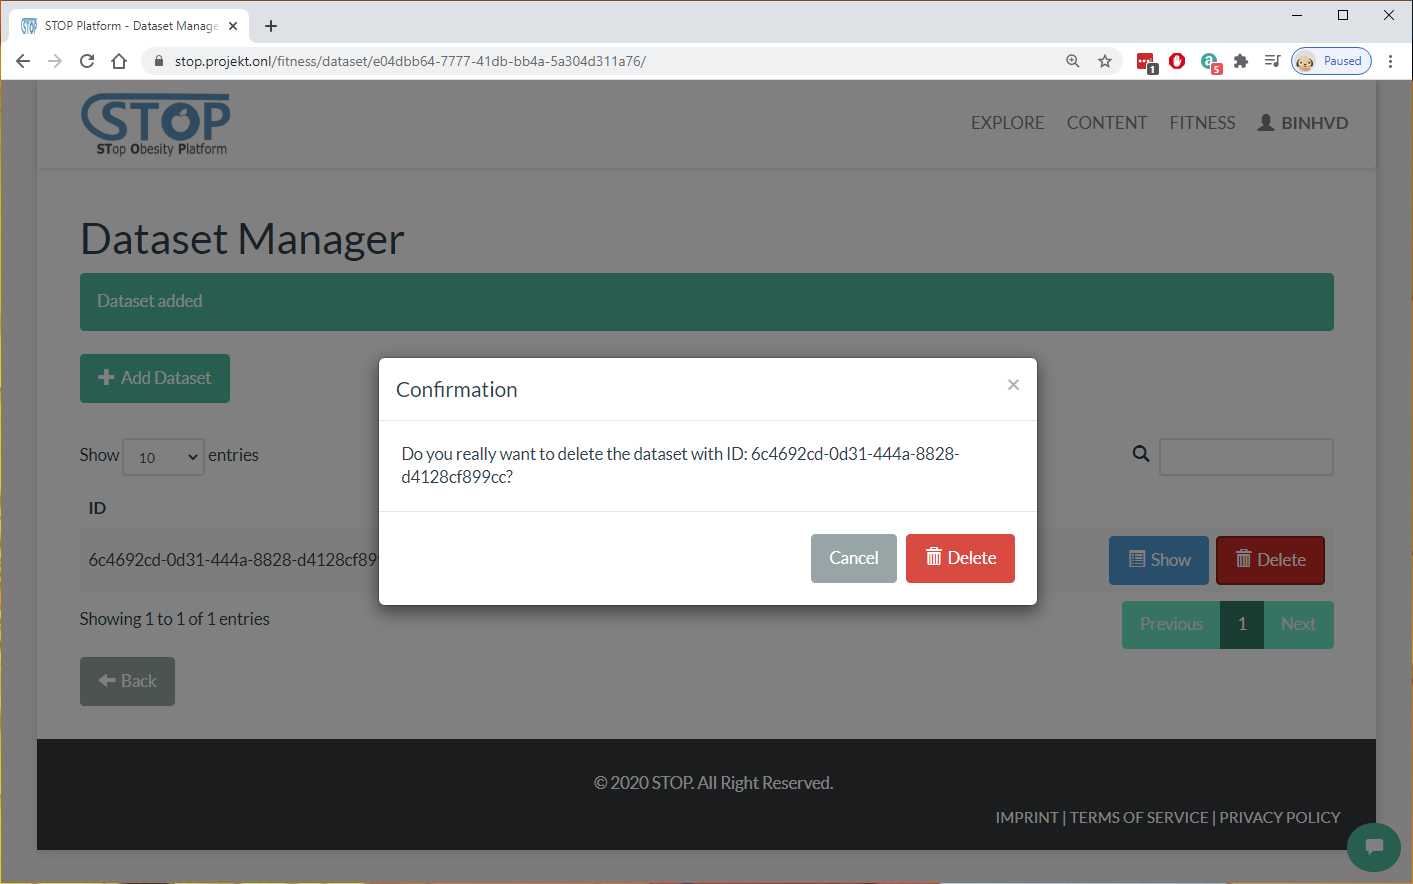
Figure 3‑6: Delete a dataset
Data Visualization
This section introduces the visualization features and functionalities of the STOP portal. Fitness and sensory data are collected and visualized for the users to have better overview and understanding of their activities, food and water consumptions, and exercises. There are 3 categories where data is visualized. They are fitness tracking for current date, fitness history, and sensory dataset.
Fitness Overview
The Fitness Overview provides a quick look at users’ fitness current progress compare to their target each day. This feature can be accessed from the Fitness > Overview menu. In figure 4-1, users’ current status in water consumption, food consumption, exercises, and steps, are visualized. Meanwhile, the target is either calculated by the system based on user’s fitness profile or imported from an external service, such as Fitbit. Users will need to overcome this target in order to reach their fitness goal.

Figure 4‑1: Fitness overview minimized
Each category in the Fitness Overview can be expanded or hidden. The “Today” tab shown in Figure 4-2 provides a quick overview of water consumption, food consumption, exercise, or activity by listing all records belong to these categories created in the current day. The Add buttons provide quick access for the users to add more record. Users can quickly import new data from their wearable device by clicking on the “Sync Now” button without going to the Synchronize menu.
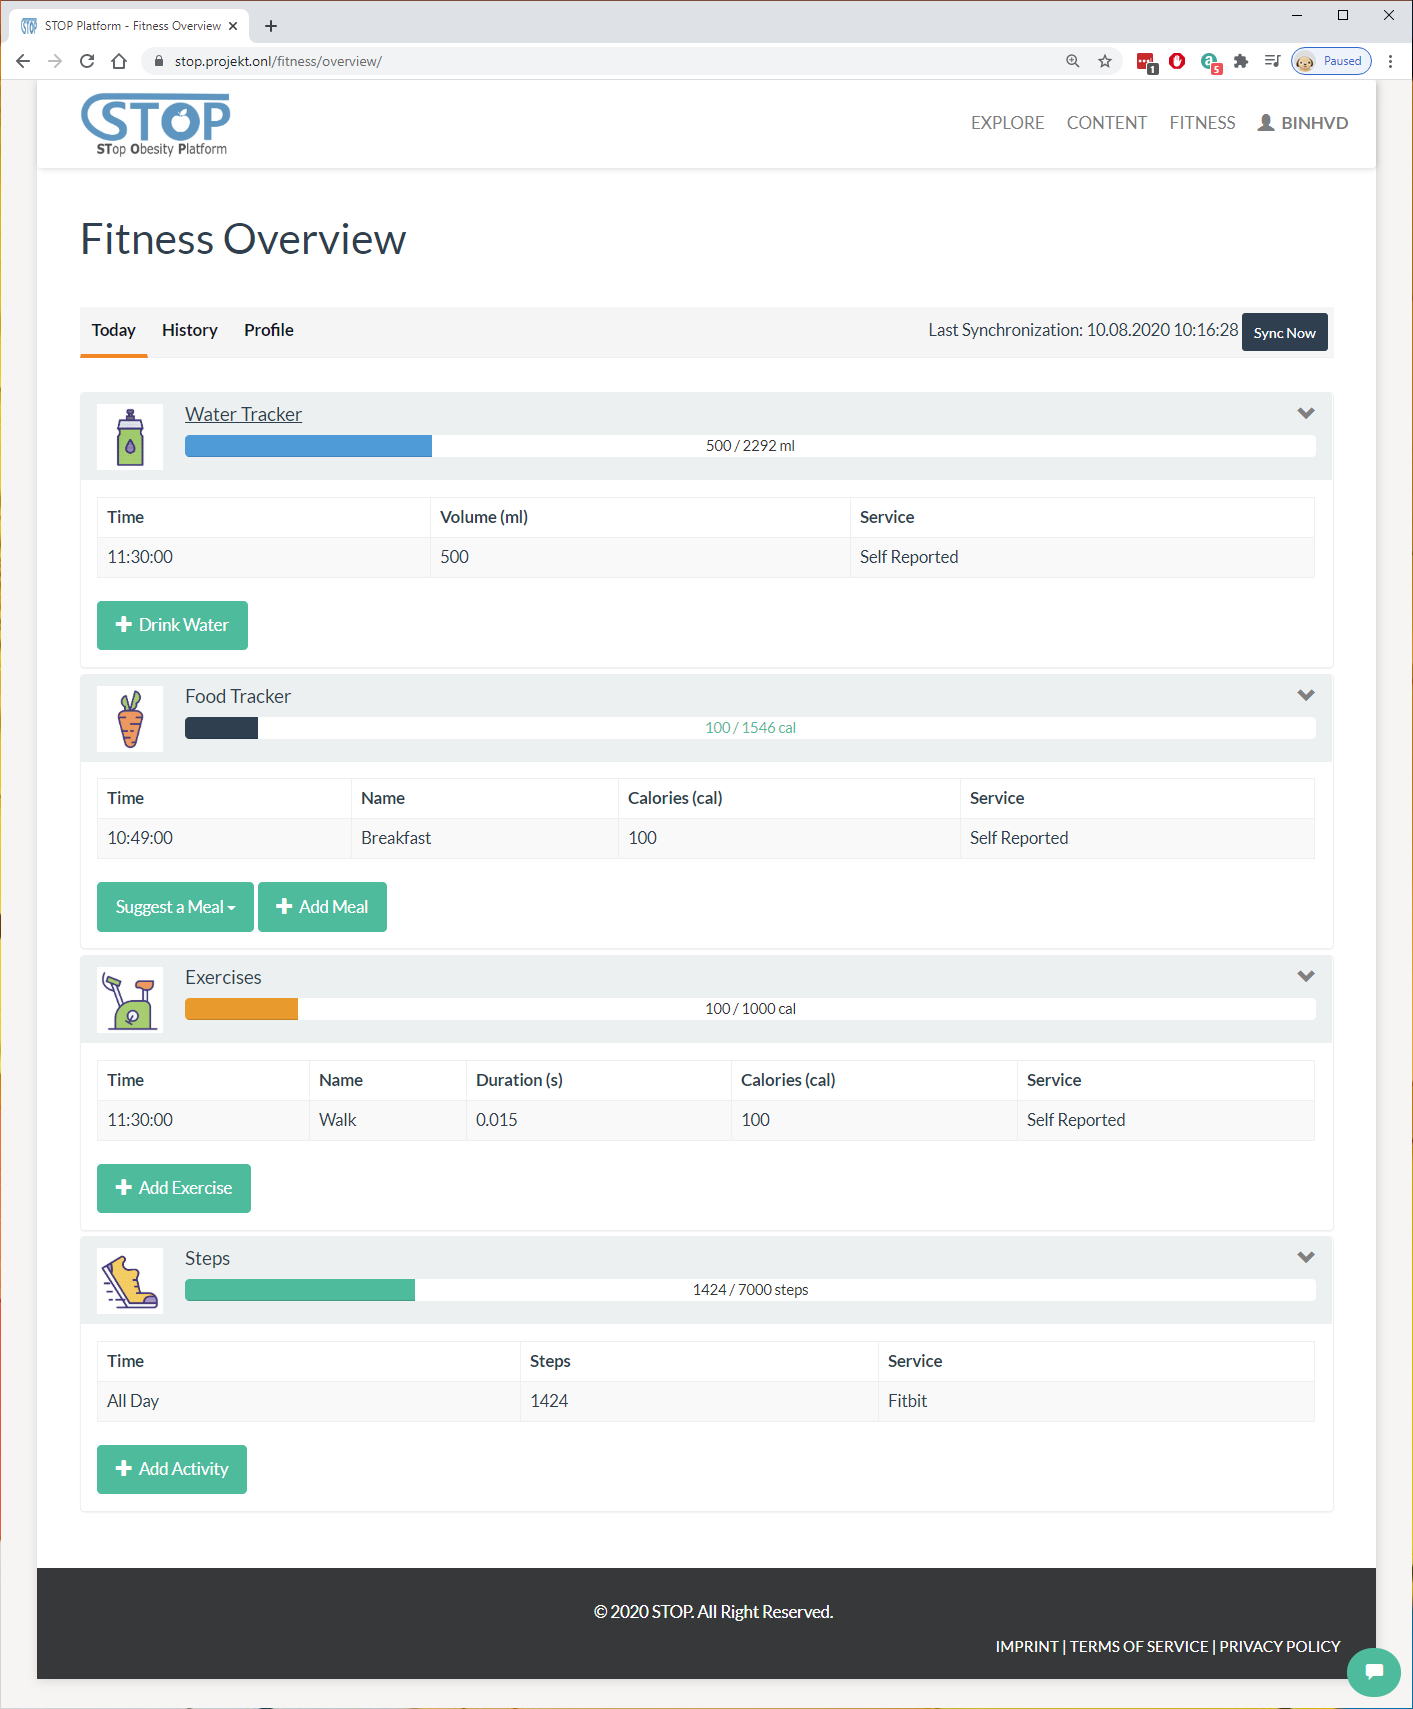
Figure 4‑2: Fitness overview maximized
Fitness History
Unlike the “Today” tab, where all data in a day is presented, the “History” tab (Figure 4-3) visualize fitness data from a date range. Users can select a start and end date where they want to visualize all the records created inside this period. After clicked on the “View History” button, a chart with 2 axes will be generated for each category, such as steps, exercises, meals, waters. This helps users to have a better view over their activities over time.

Figure 4‑3: Fitness activities over time
Sensory Dataset
Another visualization users can use is viewing the dataset as shown in Figure 4-4. While viewing a dataset, users can read all information related to it, such as ID, frequency, activity. Furthermore, they can preview the data in the CSV format and download the full file. Finally, a chat with 2 axes that visualize that data is presented.

Figure 4‑4: View a dataset
Feasibility Study Preparation
The output of this deliverable is in the mean of a demonstration. Beside the screenshots presented in this document, a demonstration video can be found here:
The video was uploaded to the STOP portal and published using the same knowledge management system presented in this document.
Furthermore, the STOP Data and Knowledge Management, Pre-Processing, and User Interaction that was shown here will be re-used in the feasibility study, which is scheduled in the next few months. The system then can be extended and adapted based on the result of this study.
The procedure as well as result of the feasibility study will be reported in another deliverable.

Deliverable D2.2
STOP Data and Knowledge Management, Pre-Processing, and User Interaction layer first release
|
Work Package |
Data and Knowledge Management, Pre-Processing and User Interaction- Component and Service Refinement and Implementation |
|
Task(s) |
|
|
Author(s) |
Binh Vu, Felix Engel |
|
Document ID |
D2.2_ STOP Data and Knowledge Management, Pre-Processing and User Interaction layer first release_M18 |
|
Approver |
Matthias Hemmje |
|
Creation date |
11/08/2020 |
|
Last update |
21/09/2020 |
|
Version |
2020.09.21_final |
|
Supersedes |
NA |
|
Dissemination Level |
PU |
*All dates in dd/mm/yyyy format
Document Log
|
Date |
Author |
Changes |
Version |
Status |
|
11/08/2020 |
Binh Vu |
ToC |
2020.08.11_V1 |
draft |
|
12/08/2020 |
Binh Vu |
Add section 3, 4, 5 |
2020.08.12_V1 |
draft |
|
18/08/2020 |
Felix Engel |
Revision of section 1, 2, and 3 |
2020.08.13_V1 |
draft |
|
18/08/20 20 |
Binh Vu |
Update section 2, 3, 4 |
2020.08.18_V1 |
draft |
|
21/08/2020 |
Binh Vu |
Refer figures in text |
2020.08.21_V1 |
draft |
|
04/09/2020 |
Binh Vu |
Update section 1 |
2020.09.04_V1 |
draft |
|
17/09/2020 |
Binh Vu |
Update section 5 |
2020.09.17_V1 |
draft |
|
21/09/2020 |
Felix Engel |
Edit section 1 |
2020.09.21_final |
final |
Contents
2 Data and Knowledge Management: Cognitive Walkthrough 7
2.1.3 Fitness Data Importing 12
2.1.7 Water Consumption Manager 28
2.2.4 Content and Knowledge Importing 48
2.2.6 Content and Knowledge Searching 54
3 Sensory Data Fusion: Cognitive Walkthrough 55
5 Feasibility Study Preparation 63
Introduction
The STOP project will address the health societal challenge of obesity with the specific objectives of mitigating the enormous and growing Health Care costs of obesity and related health issues. The project proposed solution is the foundation of an innovative platform to support Persons with Obesity (PwO) with better nutrition under the supervision of Healthcare Professionals. Therefore, the STOP Platform will capture various PwO data from different kind of smart sensor streams and Chatbot technology, manage and enrich available data with existing knowledge bases and fuse these by machine learned driven Data Fusion approaches for sophisticated AI data analysis.
The WP2 has a strong relation with other WPs, especially in refining and implementing of the STOP platform architecture which is for convenience as well depicted in Figure 1-1. To provide a better overview of the integration of this report with the architecture, we will shortly summarize some key points. The architecture contains a Persistant Layer (located in the cloud), which consists of a Structured Content area (Digital Library and Multimedia Archive) for the Content and a Knowledge Network (KN) for KOs (details see D2.1). The KM-EP is based on a flexible integration architecture with service harmonization capabilities (an architecture about KM-EP could be found in D2.1).

Figure 1‑1: STOP Platform Architecture Data & Knowledge Ecosystem
As marked with different colours in the figure, the platform is combined the works of WP2 and WP3. Overall, the project Work Package 2 (WP2), which is described in this deliverable, is focused on topics related to:
- Sensory Data Fusion: Merging raw data with captured data into KOs
- Data & Knowledge Management – KM-EP: Manages the SDF input and output
- Information Visualisation: Visualise the Content and Knowledge
Other parts of the STOP platform, such as e.g. AI Chatbot and Gamification App, are reported in other deliverables. This report is the second deliverable of the work package 2 with scope on the first STOP Platform release that is conceptualised in the deliverable 2.1 (see Figure 1-2).
Figure ‑: Relation of STOP deliverables
The aim of this report is to document the project achievements to the following objectives:
- O2.2: Conduct software implementation and refinement activities of policies and workflows to enable access and use of data and meta data, managed through the STOP Platform, besides establishing security functionalities, Semantic Data Integration and Fusion.
- O2.3: Conduct software implementation and refinement activities, of innovative Visualisation algorithms and techniques to support case pilot specific user interaction with managed data.
To address the scope of this report and above objectives, project work in WP2 is split in in five tasks. The structure of this report will follow the order of tasks (from DoA) that are already worked in during various secondments. The first four tasks are already relevant for this report and copy and pasted for convenience:
- T2.1 Task lead: CIT. Contributors: FTK, Sensory interfaces Implement an initial selection of sensory interfaces for the STOP Platform. These interfaces will provide a generic approach to engage different types of wearable sensors into the STOP Platform. To be further managed and enriched through the Data Management component. (Secondment No. 2, 12, 23)
- T2.2 Task lead: CIT. Contributors: FTK, Data Fusion Research, selection and integration of machine learning algorithms to be used sensory Data Fusion. (Secondment No. 2, 12, 23)
- T2.3 Task lead: FTK. Contributors: CIT, OKK. Data & Knowledge Management: implementation, refinement and documentation Implementation, refinement and documentation of Semantic Data Integration and Fusion functionalities. This will enable broad subsequent processing and data exchange throughout system barriers and comprehensive Knowledge Management with available data. Actually, the semantic Data Fusion could as well be regarded as a semantic information integration process that enables a unified and unique data access interface. Therefore, amongst others a formal extensible ontology will be developed and validated to represent the relevant concepts and relations of the food domain. Address ethical implications that goes along with the platform implementation and refinement of workflow and access functionalities. (Secondment No. 3, 7, 25)
- T2.4 Task lead: OKK. Contributors: CIT, FTK. Visualisation: Implementation, refinement and documentation. An intuitive visualisation dashboard will be designed that is personalised to each user. The visualisation will complete the loop in the quantified-self paradigm by enabling effective feedback for reflection, planning, actionable insights and for self-understanding. The visualisation will be co-designed with users to ensure that it is useful and user-centred. The visualisation will be interactive in nature and will allow the user to interrogate the data on multiple levels of detail where the sophistication and granularity is controlled by the user. Interpretation of the visualisation will be validated using the concurrent think-aloud protocol otherwise known as a cognitive walkthrough with users. Finally, the visualisation will be audited using design principles and heuristics from Gestalt psychology. (Secondment No. 8 & 13).
The report documents four cognitive walk through of the Platform components Data and Knowledge Management, Sensory Data Fusion, and Data Visualisation. Each walkthrough demonstrates stepwise the functionality of the system components with screenshots and their descriptions.
Data and Knowledge Management: Cognitive Walkthrough
In this section, the Data and Knowledge Management developed in the context of the STOP project is presented. The walkthrough is split into a description of the data management functionality for the management of fitness data and a section that reports on the functionality for knowledge management.
Fitness Data Management
Fitness Data Manager supports users in the task of importing, creating, and managing their fitness data. They consist of several modules that helps to manage users’ activities, exercises, food and water consumptions, weights, and goals.
User Registration
Go to the STOP portal at https://stop.projekt.onl/. Users are required to login using their username and password. Unregistered users click on “Register” button to go to the registration page (see Figure 2‑1).

Figure ‑: User registration UI
Users will need to fill in their personal information and choose a username and password to complete the registration process. All optional and required fields are presented in Figure 2‑2.

Figure ‑: User registration form
Fitness Overview
After completed registration and login using username and password, users are required to create a fitness profile. This step is needed for the system to calculate a personalized fitness plan for each user (Figure 2‑3).

Figure ‑: Create a fitness profile
The fitness profile also requires user’s current weight. The current weight could be added through the form shown in Figure 2‑4.

After the fitness profile was created, user can edit it by going to menu Fitness > Overview on the navigation bar. Figure 2-5 shows the editing form.

Figure 2‑5: Edit fitness profile
Fitness Data Importing
Users have the possibility to import their fitness data from a wearable device. By going to menu Fitness > Synchronize > Fitbit, users can access and import data from any Fitbit device (Figure 2-6).
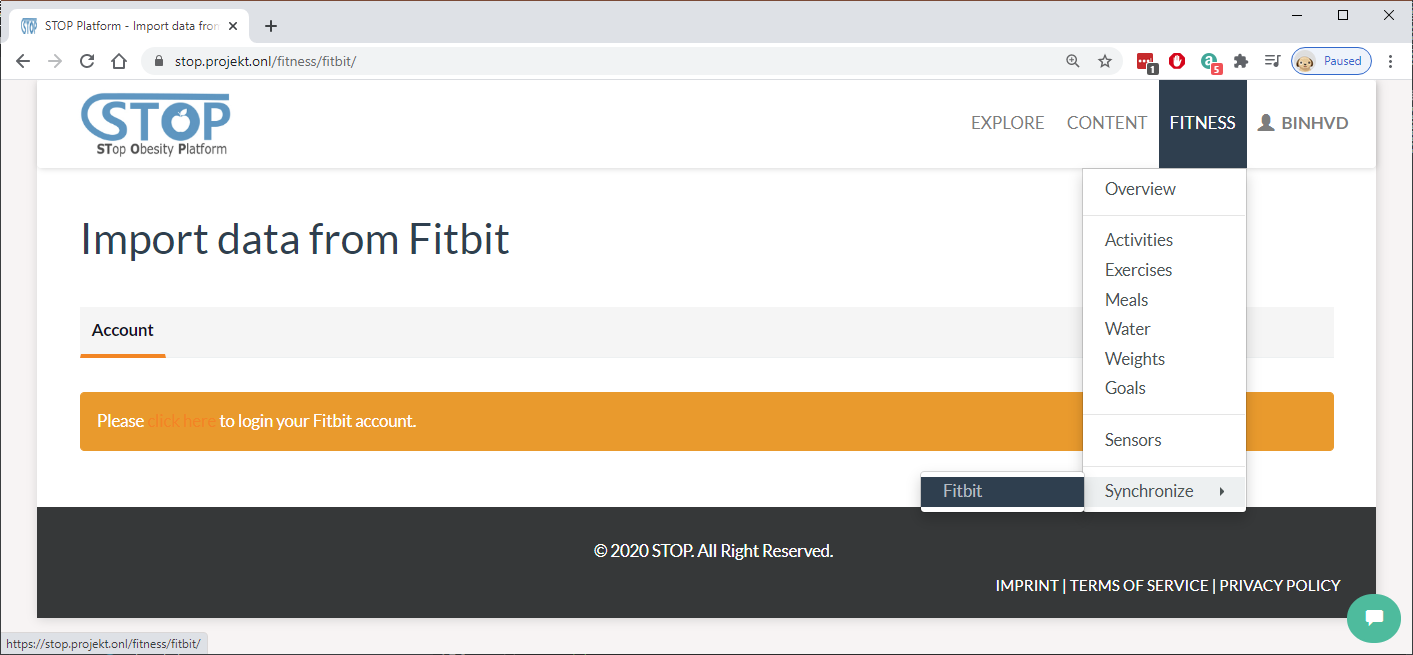
Figure 2‑6: Import from Fitbit
Users will need to authorize the STOP portal to access their fitness data by logging in using their Fitbit account. Figure 2-7 presents Fitbit’s login interface.

Figure 2‑7: Login Fitbit account
After authorized the STOP portal, users will be redirected back to the portal. Here, they can choose to access to new data created since the last import. If users haven’t import data from this service before, the system will suggest to load all data created from the last 3 months.
Users have the option to change the import date then click on the “Load New Records” button to download their fitness data (Figure 2-8).
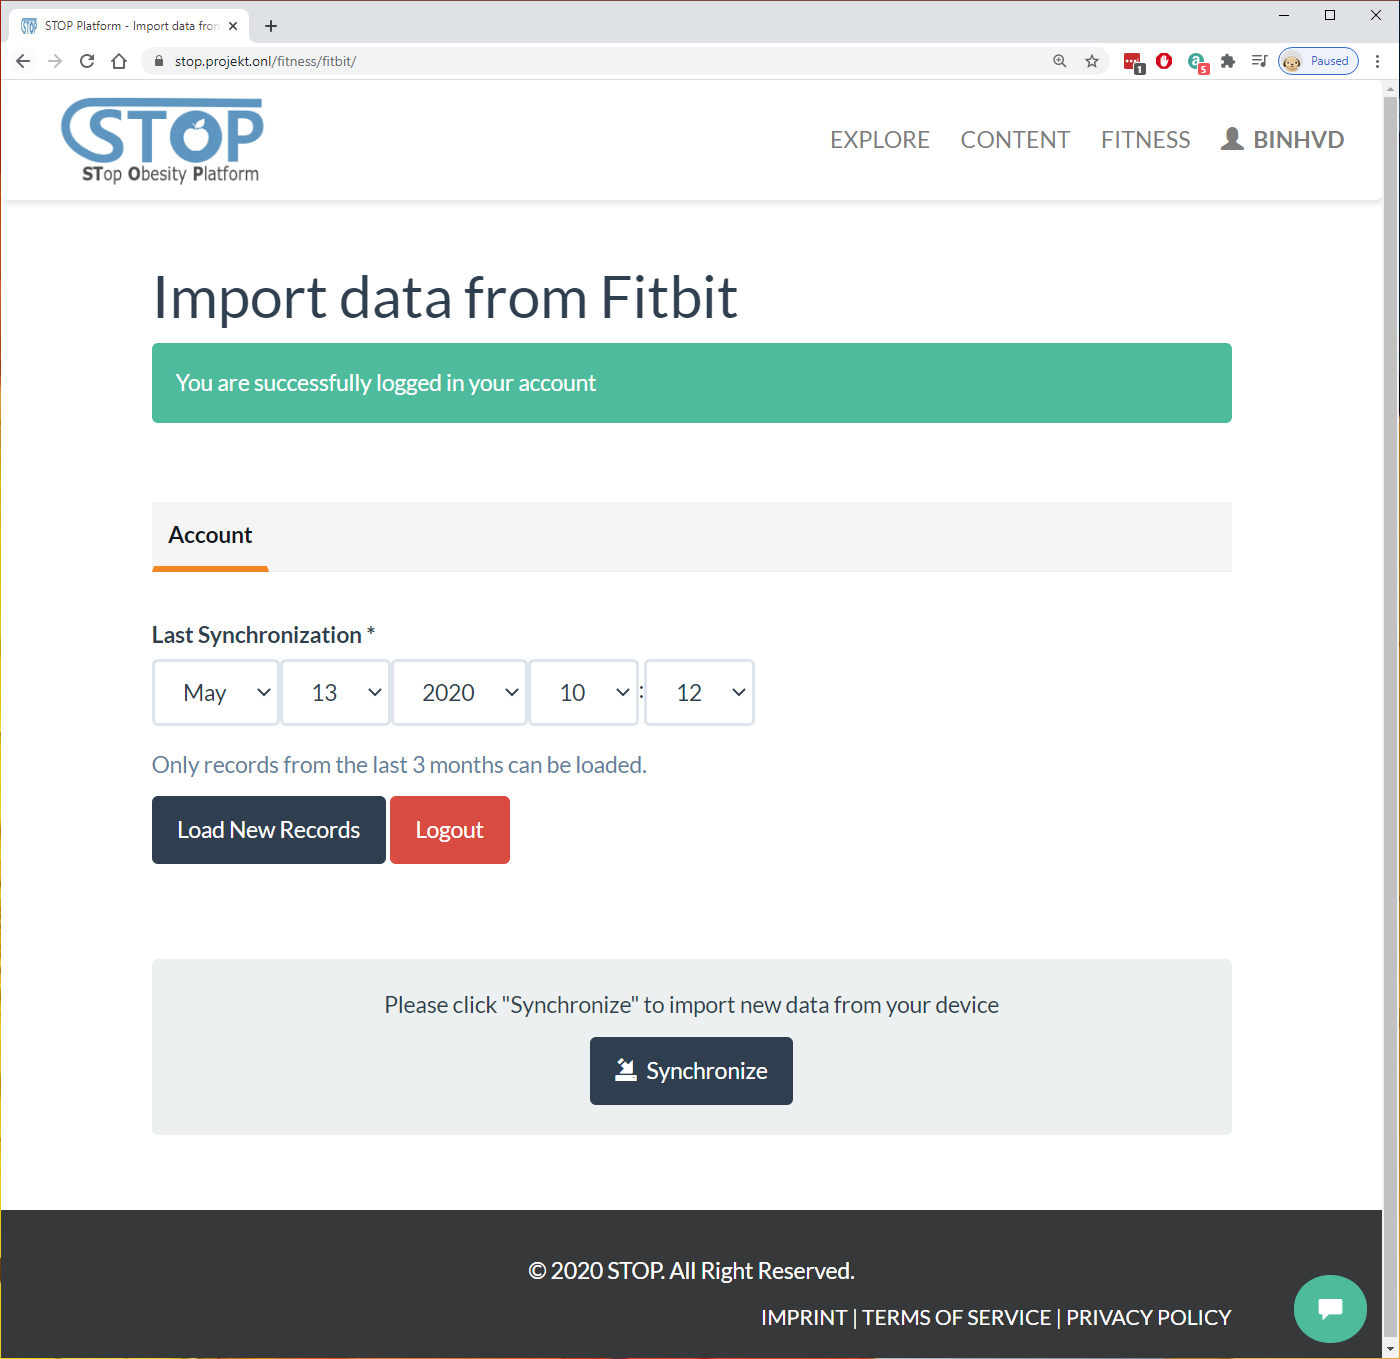
Figure 2‑8: Load data from Fitbit
After loading fitness data from Fitbit, users can preview them. There are 6 types of fitness data loaded: Activities, Exercises, Weights, Foods, Waters, and Goals. As shown in Figure 2-9, users can click on the “Activities” tabs to browse the activity records. They can also search for specific record by using the search box.

Figure 2‑9: List loaded activities
Similar to activity, users can browse exercise records in the “Exercises” tab. The related data for each exercise is shown in Figure 2-10.

Figure 2‑10: List loaded exercises
Users can look at their weight-related data each day in the “Weights” tab as shown in Figure 2-11.

Figure 2‑11: List loaded weights
If users enter their food consumption, such as food name, consumption time… to their Fitbit account, it will be listed in the “Foods” tab (Figure 2-12).
The same applies to water. It will show how much water user drank each day.

Figure 2‑12: List loaded foods
Finally, the last tab shows the target users added or calculated by Fitbit based on the users’ fitness profile (Figure 2-13).

Figure 2‑13: List loaded goals
After viewing all their data, users click on “Synchronize” button at the end to import them to the STOP portal. The system will show how many records were imported successfully as in Figure 2-14.

Figure 2‑14: Import data successfully
Activity Manager
After fitness data was imported, users can manage their data in the “Fitness” menu. To manage activity data, users can go to Fitness > Activities menu. In Figure 2-15, all activity records are listed. Users can either edit existing records by clicking on “Edit” button or create a new activity by clicking on “Add Activity”.

Figure 2‑15: List created activities
In the “Add/Edit Activity” page as shown in Figure 2-16, users need to fill out the required fields, such as “Log Date”. Other fields, such as “Log Time”, “Distance”, “Steps”, are optional. After filling out all the information, users click on “Create/Save” to create a new activity or save the edited record. Furthermore, users can also click on “Cancel” button to come back to the listing page.

Figure 2‑16: Edit an activity
On the listing page, users click on the “Delete” button of a record to remove this record from the database. The system will ask for users’ confirmation to make sure that they have not clicked on this button by mistake (Figure 2-17).
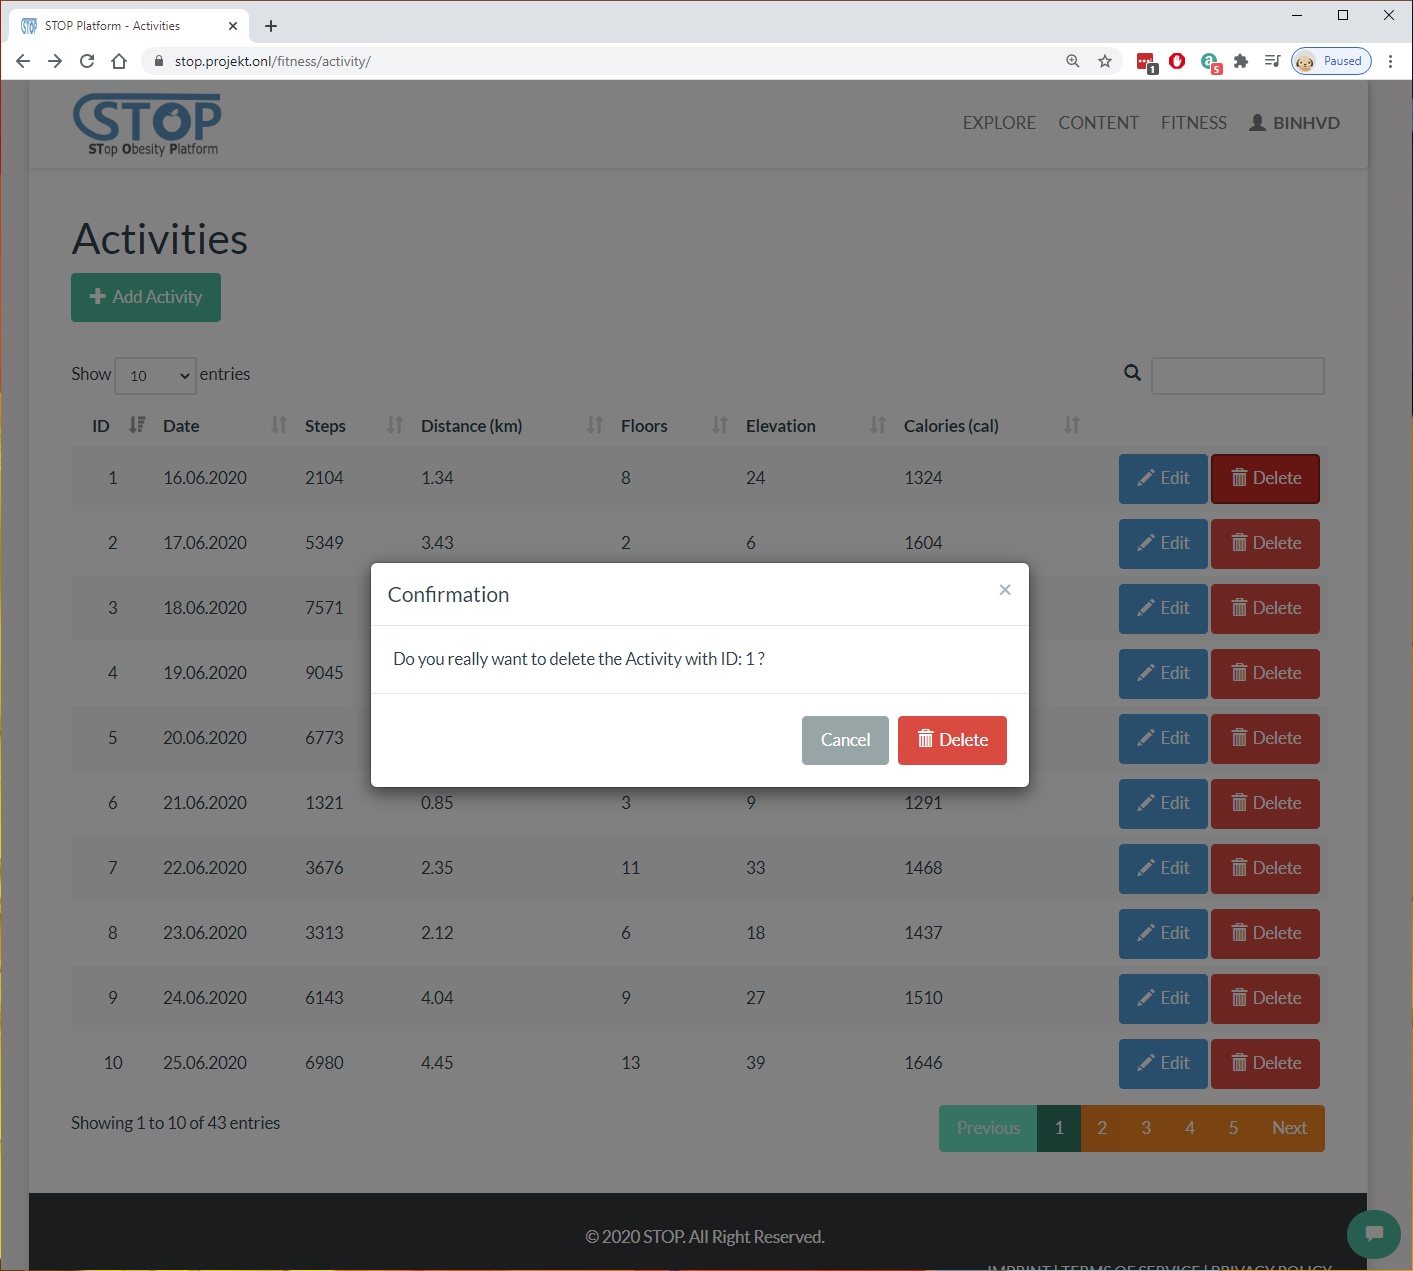
Figure 2‑17: Delete an activity
Exercise Manager
Next to “Activities” menu is the “Exercises” menu, where users can manage their exercise records (Figure 2-18). Similar to “Activities”, users can click on “Edit” button to edit existing record or “Add Exercise” button to create a new exercise.

Figure 2‑18: List created exercises
In the “Add/Edit Exercise” page shown in Figure 2-19, users will need to fill out the information related to their exercise, such as name, date, description, distance, etc. After completed this step, users click on the “Create/Save” button to save the input to the database. Users can stop this process and go back to the listing page anytime by clicking on the “Cancel” button.

Figure 2‑19: Edit an exercise
On the listing page, users can delete a record by clicking on the “Delete” button at the end of the row. Figure 2-20 shows the system asking users once more time before removing the record from the database.

Figure 2‑20: Delete an exercise
Meal Manager
Users can manage their food consumption by selecting Fitness > Meals menu (Figure 2-21). Here they can ask the system to suggest a recipe for their next meal or add a meal that they just ate. Furthermore, users can edit the created record in the list.
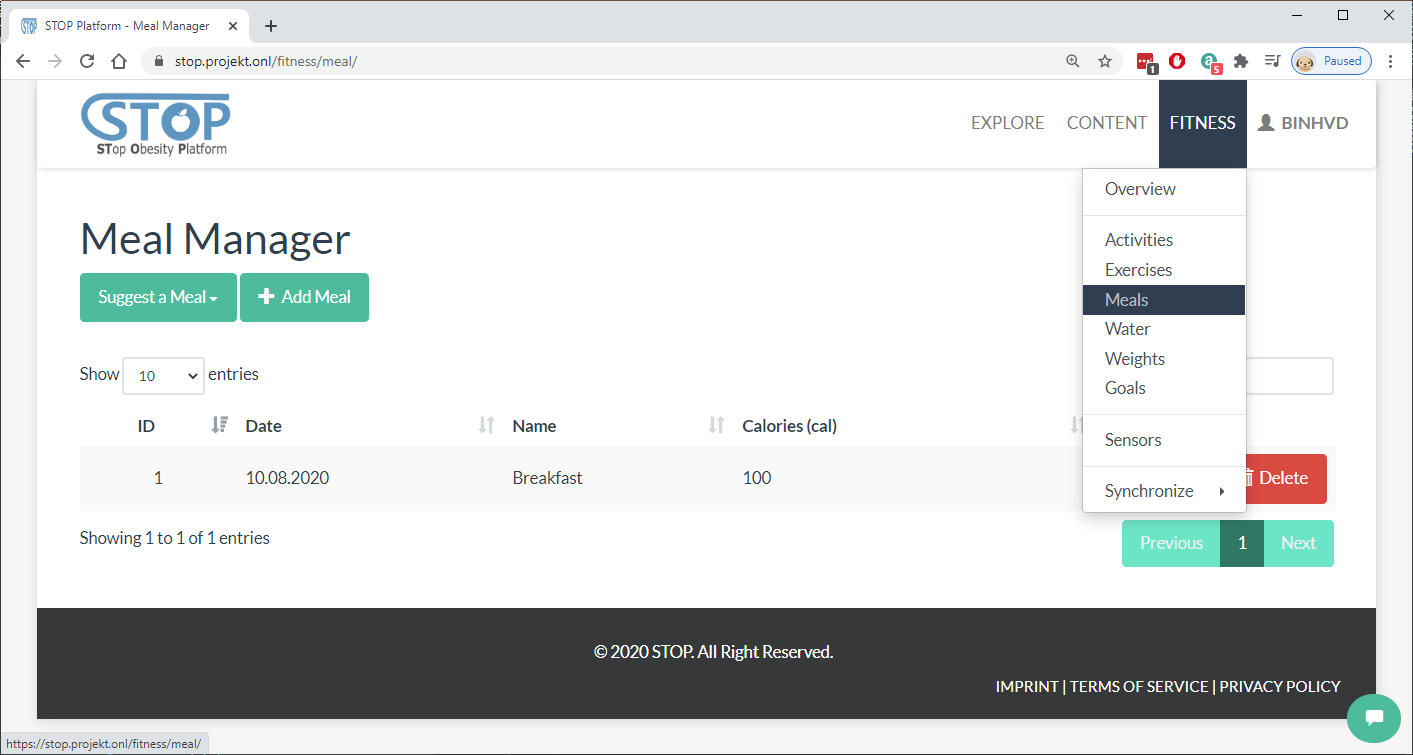
Figure 2‑21: List created meals
In the “Add/Edit Meal” page in Figure 2-22, users will need to add the food they ate in the meal then click on the “Create/Save” button to save the input to the database. Otherwise, users can stop this process and go back to the listing page anytime by clicking on the “Cancel” button.

Figure 2‑22: Add a meal
Similar to other type of data, users can delete a meal record by clicking on the “Delete” button at the end of the row. The system will need users’ confirmation once more time before removing the record from the database as shown in Figure 2-23.
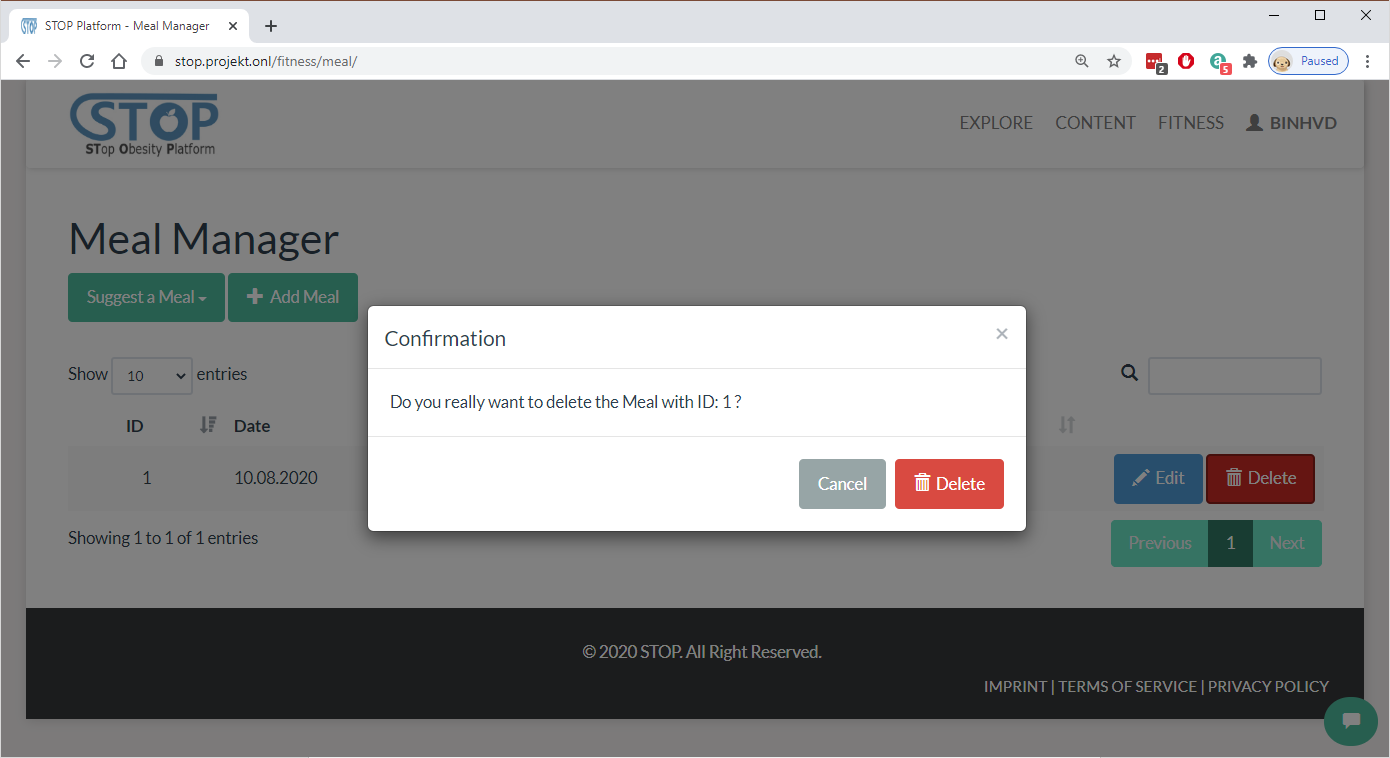
Figure 2‑23: Delete a meal
Water Consumption Manager
Users can manage their water consumption by selecting Fitness > Water menu. Here they can add a drink record to the system or edit the added drink in the list shown in Figure 2-24.

Figure 2‑24: List created water consumptions
In the “Add/Drink Water” page as shown in Figure 2-25, users fill out the timestamp and volume of the drink then click on the “Create/Save” button to save it to the database. Otherwise, users can stop this process and go back to the listing page anytime by clicking on the “Cancel” button.

Figure 2‑25: Drink water
In the listing page, users can delete a drink by clicking on the “Delete” button at the end of the row. The system will ask users if they are sure before removing the drink from the database (Figure 2-26).
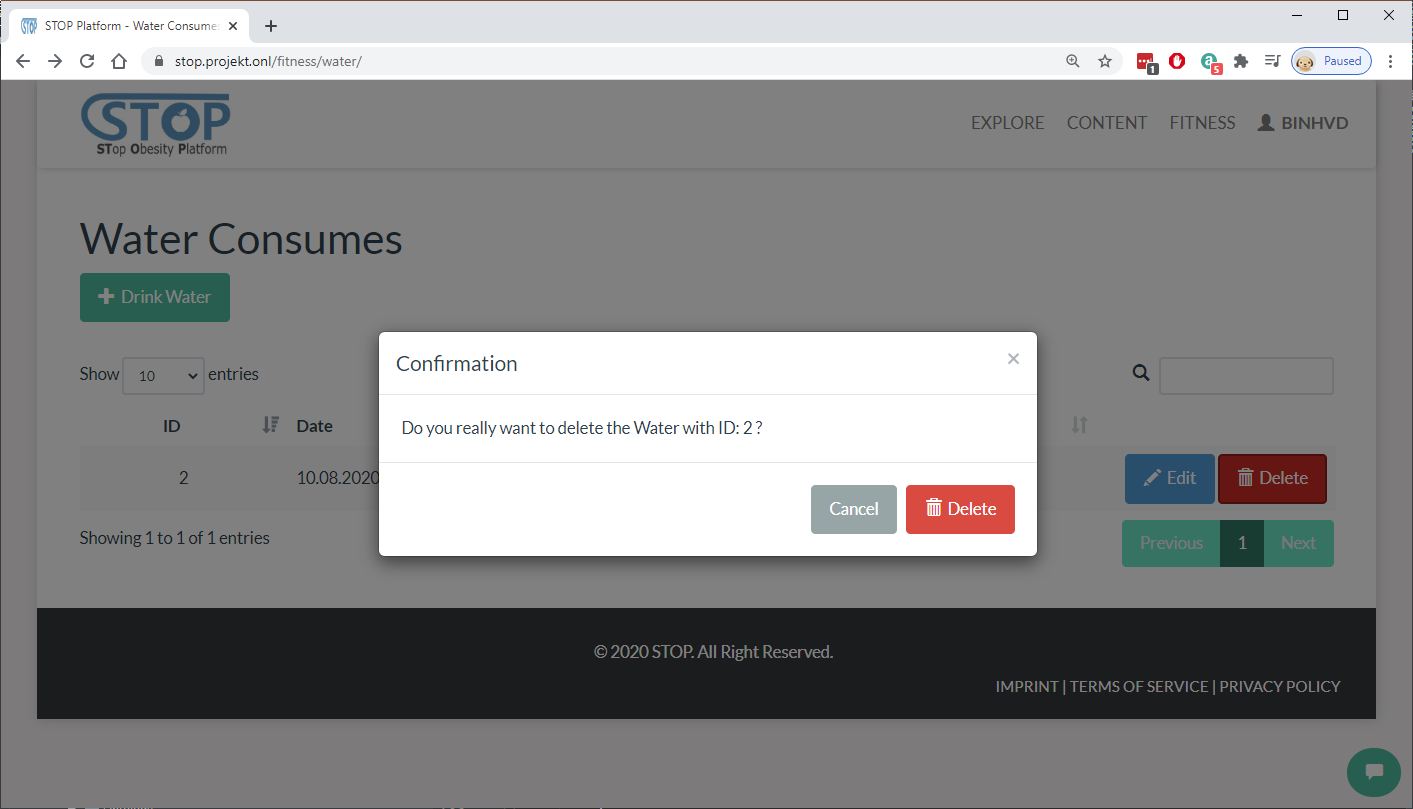
Figure 2‑26: Delete a water consumption
Weight Manager
In the Fitness > Weights menu, users can manage the changes of their weight over time. Here they can add, edit, or delete their weight records. Figure 2-27 shows the list of user’s weight records.

Figure 2‑27: List created weight records
In the “Add/Edit Weight” page in Figure 2-28, users type in their weight along with BMI and Fat value then click on the “Create/Save” button to save them to the database. Users can also click on the “Cancel” button to stop this process and go back to the listing page.

Figure 2‑28: Add a weight record
In the listing page presented in Figure 2-29, users can delete a record by clicking on the “Delete” button at the end of each row. The system will ask users if they are sure before removing the record from the database.

Figure 2‑29: Delete a weight record
Goal Manager
Finally, users can manage their fitness goals by going to the Fitness > Goals menu. Here, goals imported from fitness services and created by the users in the portal are listed. Users can create, edit, or delete them from the database as illustrated in Figure 2-30.

Figure 2‑30: List created goals
In the listing page, users can delete a goal by clicking on the “Delete” button at the end of each row. Figure 2-31 shows the system asking users if they are sure before removing the goal from the database.

Figure 2‑31: Delete a goal entry
After clicking on “Edit” or “Add Goal” button, users will be directed to the “Add/Edit Goal” page. Here, users fill out the needed information then click on the “Create/Save” button to save them to the database. Furthermore, users can click on the “Cancel” button to go back to the listing page as shown in Figure 2-32.

Figure 2‑32: Edit a goal entry
After new goals were created, users can select between them and “Auto Calculation” in the Fitness Profile anytime (Figure 2-33). This will change the user’s target for each day in the Fitness Overview visualization.

Figure 2‑33: Change goal profile
Knowledge Management
This system manages all content and knowledge in the STOP portal. New content and knowledge can either be created by the users or imported from external files and services.
Publication Manager
Users can manage publications in the Content > Publication menu. Here, they can create, edit, and delete publication records in the database. Users can also view a publication by clicking on its title. Figure 2-34 shown the management page.

Figure 2‑34: List created publications
In the Adding/Editing page in Figure 2-35, users need to fill out the metadata for the publication. The metadata is split into several groups, such as authors, identifiers, publishers, etc. In “Multimedia” group, users are able to upload and manage PDF files for the publication.

Figure 2‑35: Edit a publication
In the listing page, users can delete a publication by clicking on the “Delete” button at the end of each row. The system will ask users if they are sure before removing the publication from the database (Figure 2-26).

Figure 2‑36: Delete a publication
In figure 2-37, the “Content Display” page shows the metadata and download a publication. Here, users can view related information such as title, authors, description, etc. Furthermore, they can rate the quality of the publication as well as share it on the social networks.

Figure 2‑37: View a publication
Multimedia Manager
Users can manage multimedia in the STOP portal by selecting the Content > Multimedia menu. Figure 2-38 illustrates the record list. Here, they can create, edit, and delete multimedia records in the portal. Users can also view a multimedia’s metadata and download it by clicking on its title in the listing table.

Figure 2‑38: List created multimedia
After clicking on the “New Multimedia” or “Edit” button, users are directed into the “New/Edit Multimedia” page as shown in Figure 2-39. Similar to Publication, users need to fill out multimedia metadata and upload data here. There are different types of multimedia, such as video, presentation, audio, zip. Depend on the multimedia type, users will be able to upload different data.

Figure 2‑39: Edit a multimedia
In the listing page, users can delete a publication by clicking on the “Delete” button at the end of each row. Figure 2-40 shows the system asking users if they are sure before removing the publication from the database.

Figure 2‑40: Delete a multimedia
Users are able to look at a multimedia metadata and download or play it content in the “Content Display” page as presented in Figure 2-41. Here, users can read important information such as multimedia title, description, authors, etc. Furthermore, they can also rate this content and share it on different social networks.

Figure 2‑41: View a multimedia
Taxonomy Manager
Taxonomy is an important type of content that allows users to use it to classify content in the STOP portal. To manage taxonomies, users need to go to the Content > Taxonomy menu. In figure 2-42, taxonomies created by the users are listed for viewing, editing, and deleting. Furthermore, users can create new taxonomy by clicking on the “New Taxonomy” button.

Figure 2‑42: List created taxonomies
In the “New/Edit Taxonomy” page, users are able to create a new taxonomy or edit an exiting taxonomy (Figure 2-43). Users will need to fill out the related information such as taxonomy title, keywords, description, and authors. In the “Structure” tab, users are provided with a taxonomy building tool that supports user in the construction and management of a taxonomy.

Figure 2‑43: Edit a taxonomy
In the listing page, users can delete a publication by clicking on the “Delete” button at the end of each row. The system will ask users if they are sure before removing the publication from the database. Figure 2-44 presents the deleting page.

Figure 2‑44: Delete a taxonomy
Figure 2-45 presents the “Taxonomy Display” page, where users can view the metadata of a taxonomy, its structure, and are able to export it into different formats. Similar to publication and multimedia, users can see the current rating of the viewing taxonomy and rate it by selecting the stars in the top of the page. They are also able share the content on social networks. In the right panel, the system will suggest content that is similar to the viewing taxonomy.
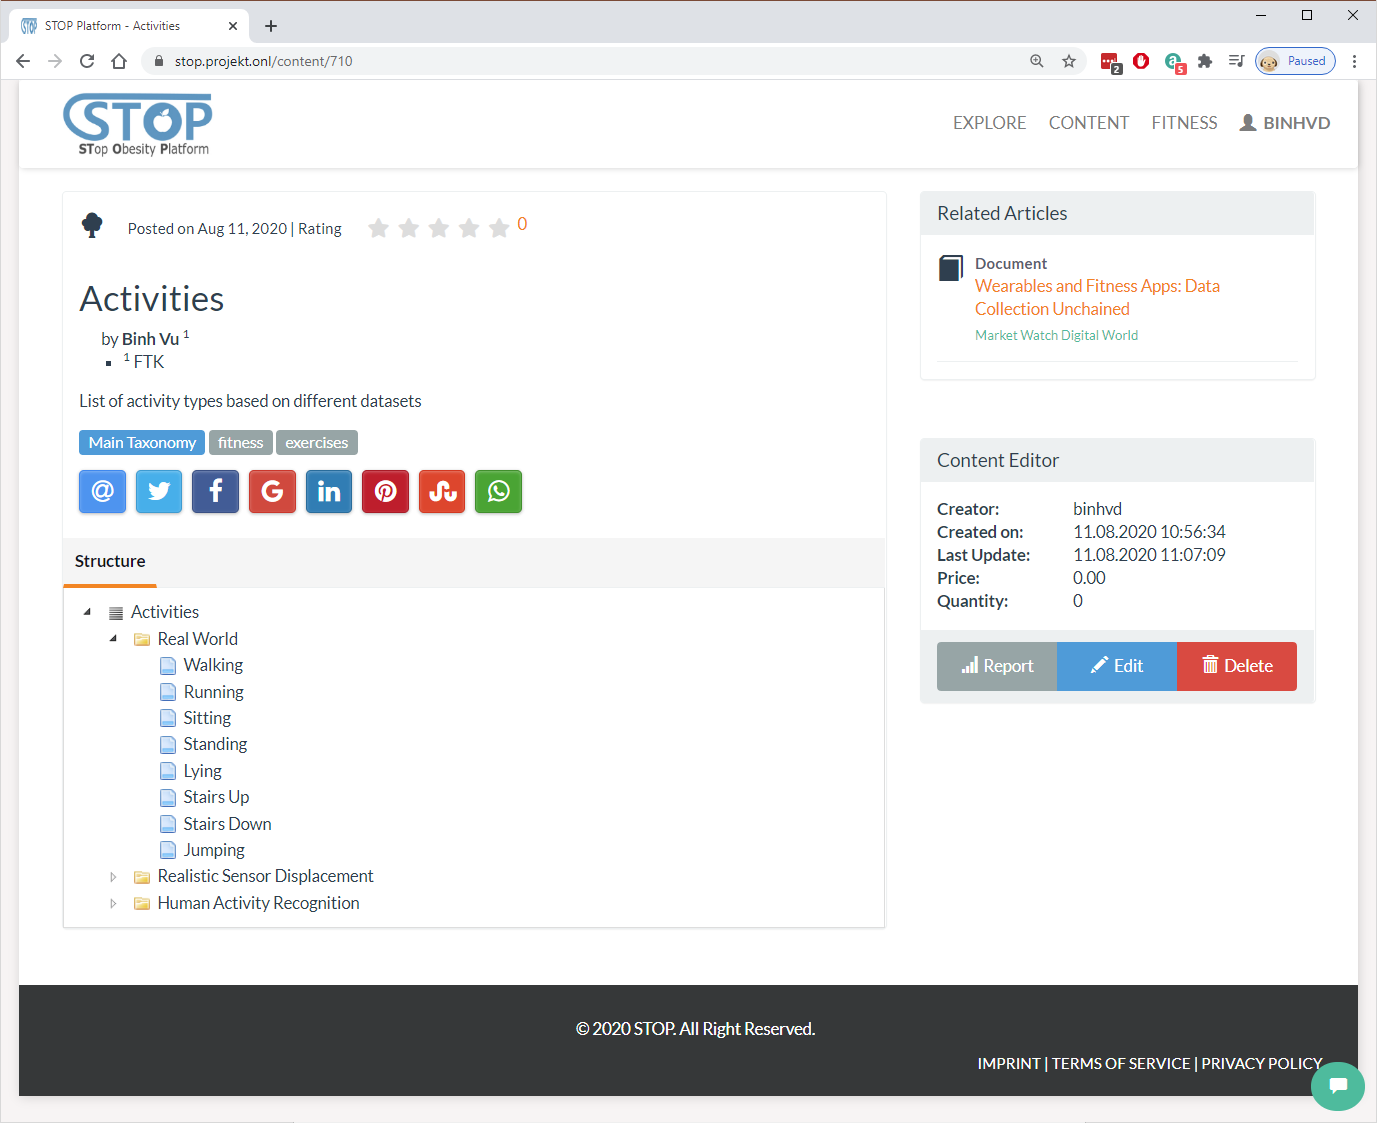
Figure 2‑45: View a taxonomy
Content and Knowledge Importing
Content can be imported from different formats, such as BibTex and OAI-PMH, and external services, such as Mendeley, SlideShare, GibHub, StackExchange, DSpace, and Youtube, to the STOP portal. To do so, users need to go to the Content > Ingest menu. Here, they can select one of the services to start the import process (Figure 2-46).
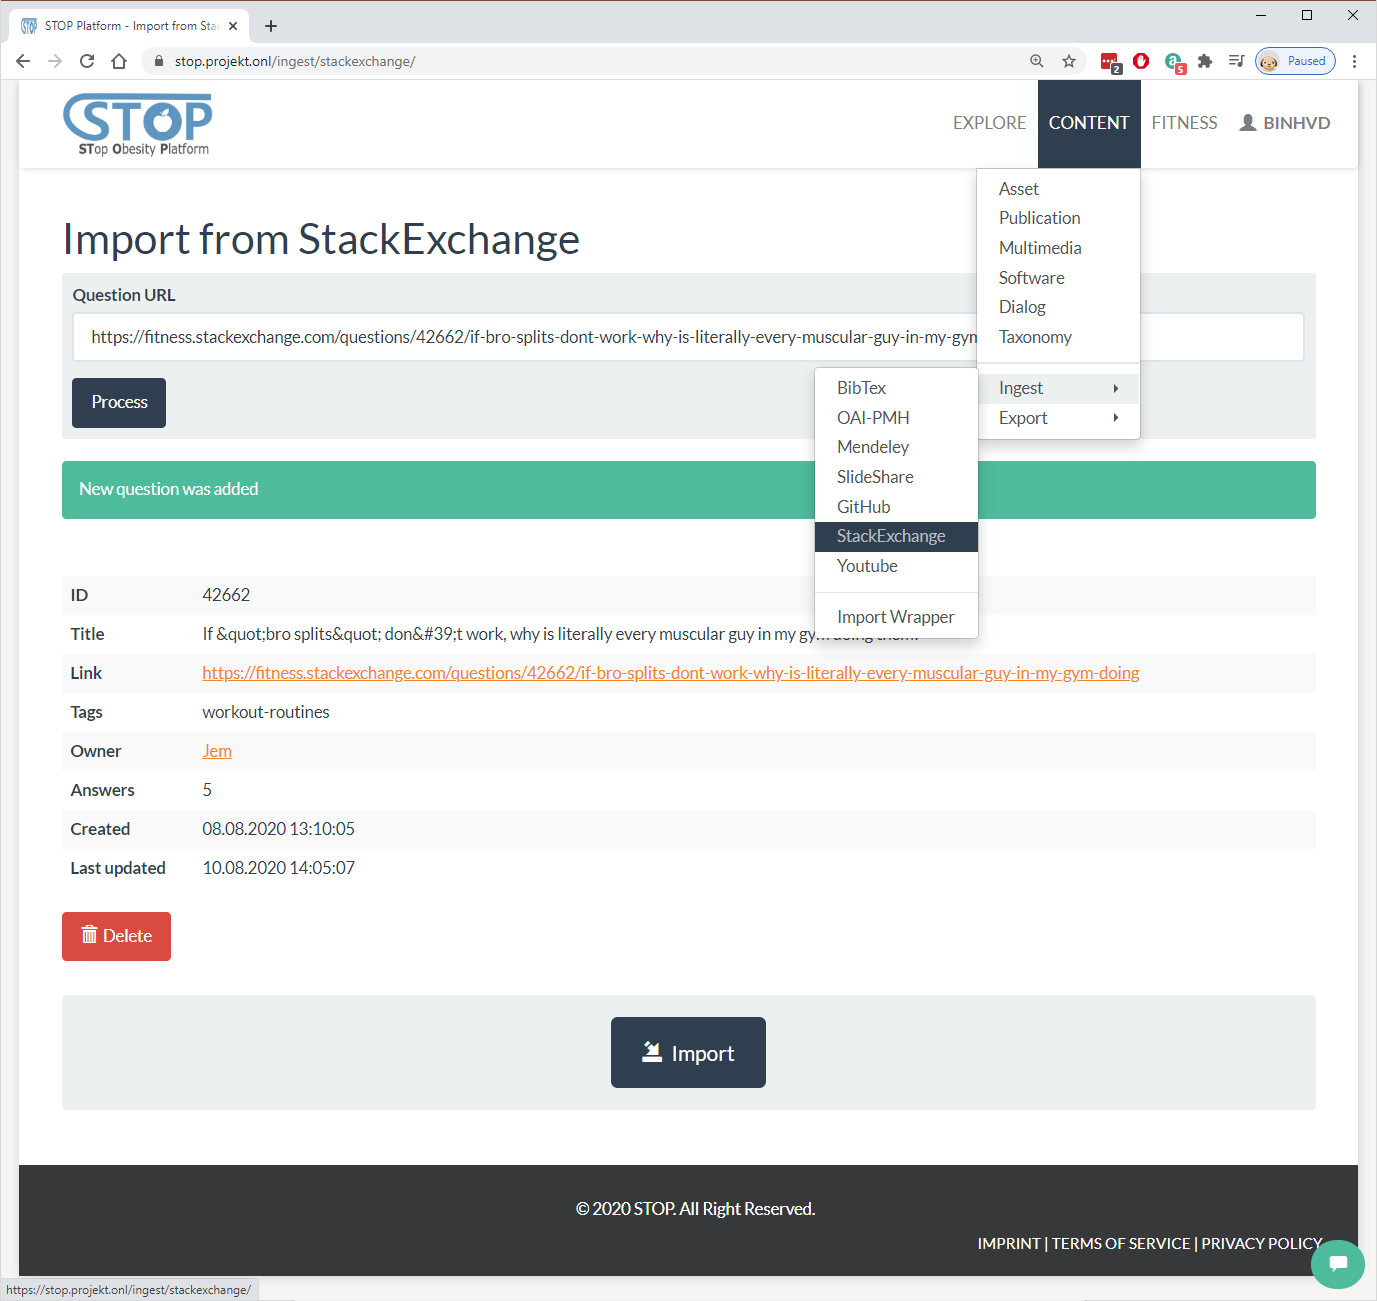
Figure 2‑46: Import a question from StackExchange
After choosing the content that needs to be imported, the system will direct users to the Import Wrapper Manager (Figure 2-47). It is where the mapping table, which tells the import system which fields from the external service can be copied to which fields in the STOP database, is managed. Here, users can change, delete, import, and export the mapping setting. After making sure the mapping is correct, users click on the “Import” button to start the importing process.

Figure 2‑47: Edit StackExchange’s wrapper
Dialog Manager
Dialog (questions and answers) can be imported from the StackExchange service. After that, they can be managed in the Content > Dialog menu. Here, users can create new dialog, edit existing records, or delete them as presented in Figure 2-48. Users can also read a dialog by clicking on its title or search for dialogs using the searching box.

Figure 2‑48: List created dialogs
Figure 2-49 shows the “New/Edit Dialog”, where users can create/edit a question by entering its title, keywords, and content. The system allows some forms of simple HTML, such as p, li, strong, etc. Users click on the “Save” button to complete the creating/editing or the “Cancel” button to stop the process and go back to the listing page.
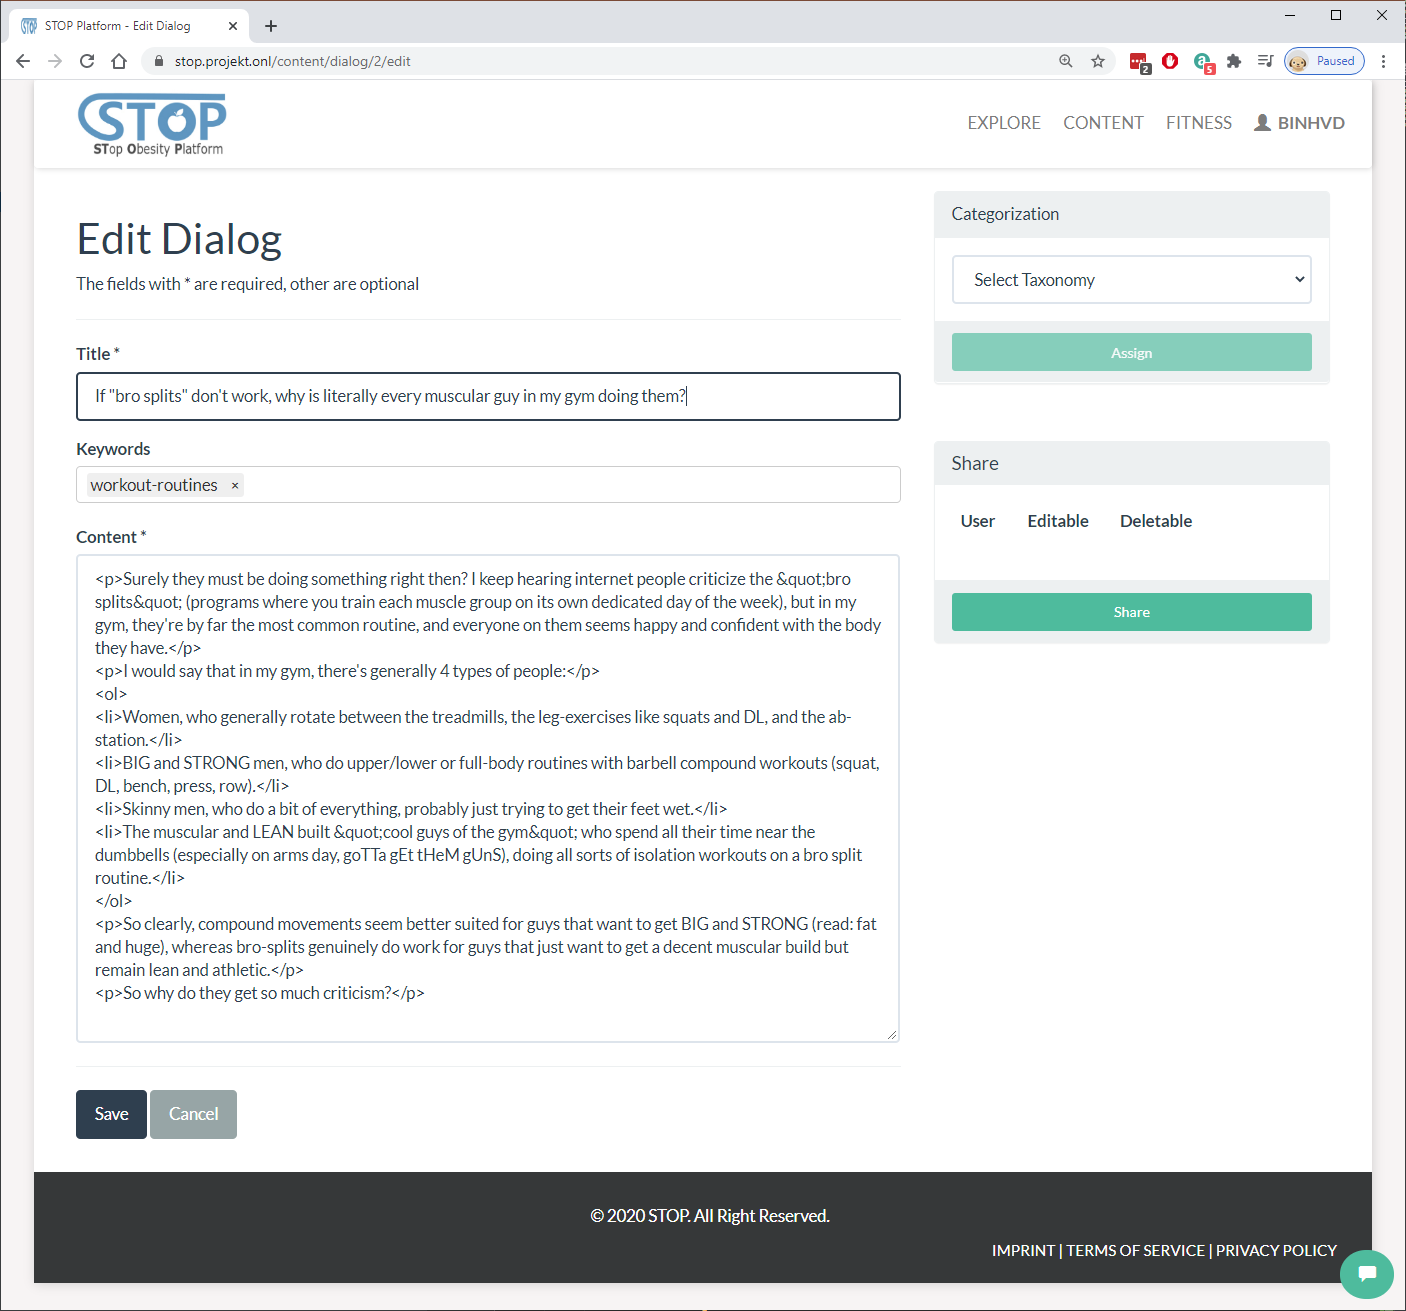
Figure 2‑49: Edit a dialog
In the listing page, users can delete a dialog by clicking on the “Delete” button at the end of each row. Figure 2-50 illustrates the final step where the system asking users if they are sure before removing the dialog from the list.

Figure 2‑50: Delete a dialog
In Figure 2-51, users can look at the questions and answers of a dialog. They can also see the upvotes for each answer and the question itself. Furthermore, users have the option to upvote or downvote an answer and the question. The timestamp and author of each answer and question are also displayed for the viewer. Finally, users can provide their answers for the posted question.

Figure 2‑51: View a dialog
Content and Knowledge Searching
Content in the STOP portal is categorized and can be searched by the users. The searching page can be reached by clicking on the “Explore” menu. As present in Figure 2-52, users can enter the searching term then clicking on the “Search” button to start the searching process. After the search result is presented to the users, they can apply filters, such as publication year, type of content, or categorization, for a narrower search result.

Figure 2‑52: Search for content
Sensory Data Fusion: Cognitive Walkthrough
In this section, the sensory Data Fusion developed in the STOP project is introduced. The system’s first release is presented in a cognitive walkthrough where its features and functionalities are described in a series of screenshots and descriptions.
Sensor Manager
Users can manage their sensors by going to the Fitness > Sensors menu. Here the list of all sensors is shown to the viewer (Figure 3-1). Simple information such as the ID of the sensors, their positions, and the number of datasets for each sensor are displayed. Users have the option to add new sensors, view their datasets, or delete sensors from the list.

Figure 3‑1: List created sensors
In the adding page, users need to choose the position of the new sensor then click on the “Create” button. They can also click on the “Cancel” button to cancel the process and go back to the listing page as shown in Figure 3-2.

Figure 3‑2: Add a new sensor
In the listing page, users can delete a sensor by clicking on the “Delete” button at the end of each row. The system will ask users if they are sure before removing the sensor from the list (Figure 3-3).
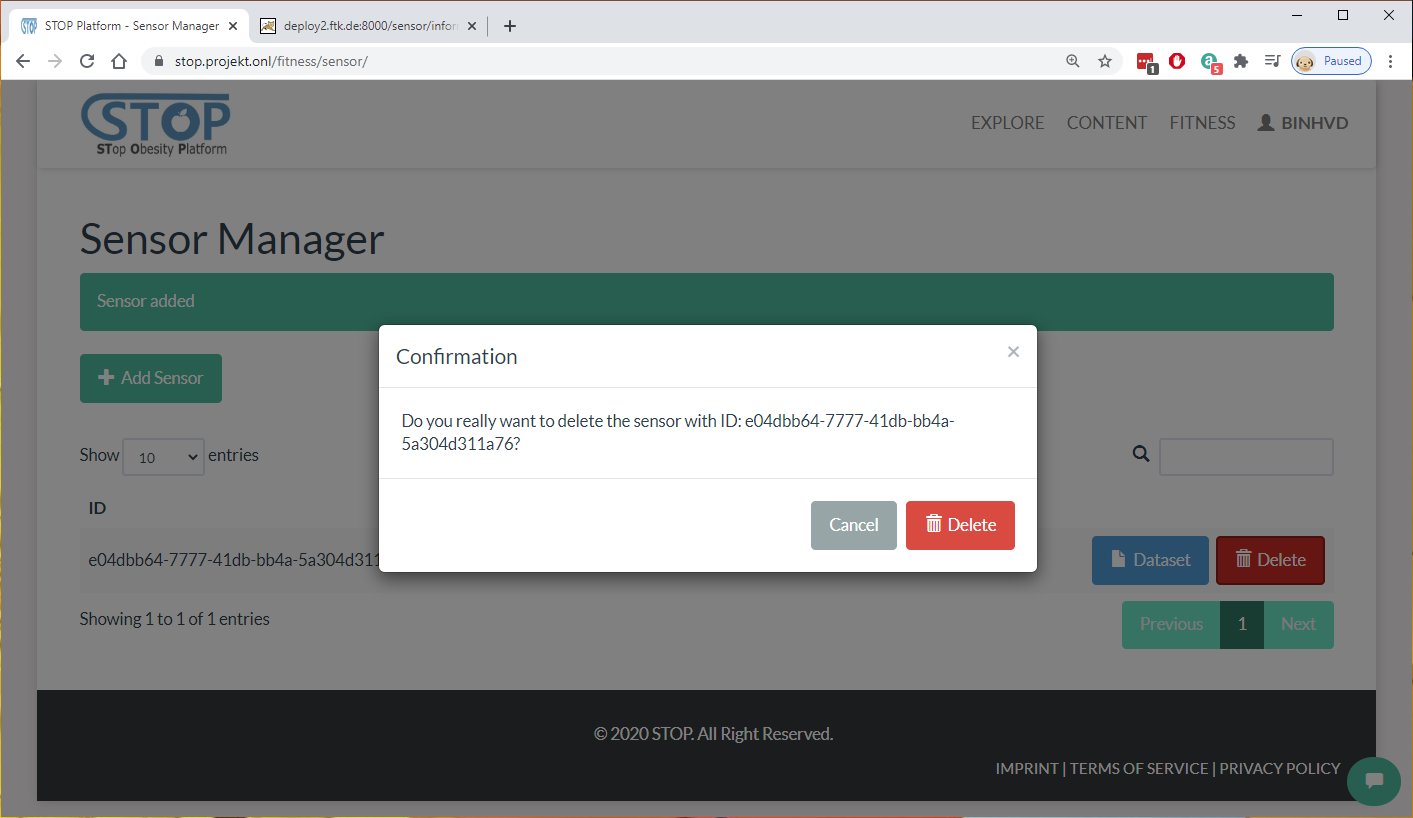
Figure 3‑3: Delete a sensor
Dataset Manager
In the dataset listing page presented in Figure 3-4, users can browse and search for datasets of a chosen sensor. The list shows all datasets belong to a sensor including their IDs, created dates, frequencies, and activities. Users have the option to add new datasets, view them, or delete them from the list.
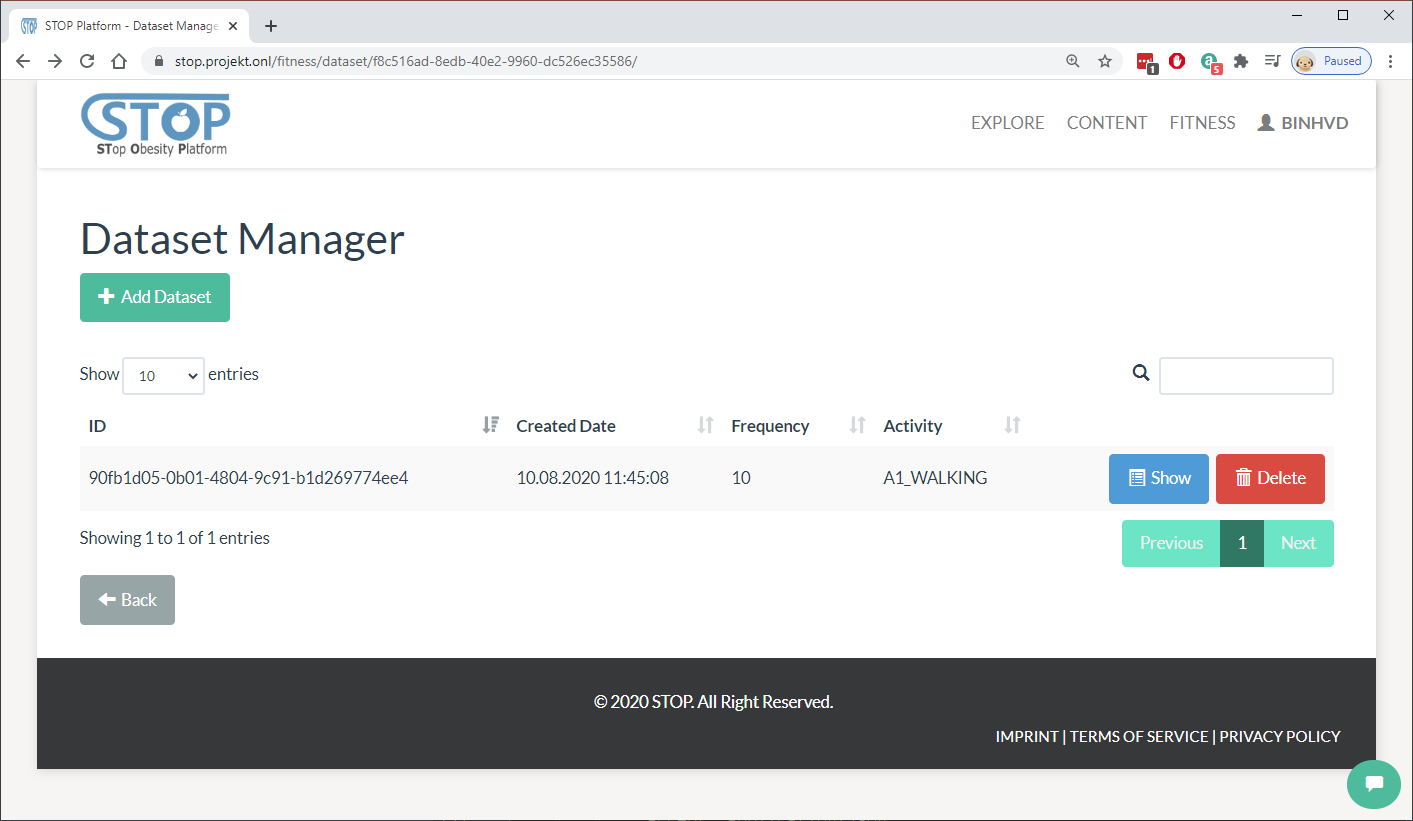
Figure 3‑4: List all datasets of a sensor
In the adding page (Figure 3-5), users need to select dataset name, enter its frequency, and select the activity, which was recorded. The raw data in CSV format can be uploaded to the system using the upload field.

Figure 3‑5: Add a dataset
In the listing page, users can delete a dataset by clicking on the “Delete” button at the end of each row. Figure 3-6 presents the confirmation step where the system asks users if they are sure before removing the dataset from the sensor.

Figure 3‑6: Delete a dataset
Data Visualization
This section introduces the visualization features and functionalities of the STOP portal. Fitness and sensory data are collected and visualized for the users to have better overview and understanding of their activities, food and water consumptions, and exercises. There are 3 categories where data is visualized. They are fitness tracking for current date, fitness history, and sensory dataset.
Fitness Overview
The Fitness Overview provides a quick look at users’ fitness current progress compare to their target each day. This feature can be accessed from the Fitness > Overview menu. In figure 4-1, users’ current status in water consumption, food consumption, exercises, and steps, are visualized. Meanwhile, the target is either calculated by the system based on user’s fitness profile or imported from an external service, such as Fitbit. Users will need to overcome this target in order to reach their fitness goal.

Figure 4‑1: Fitness overview minimized
Each category in the Fitness Overview can be expanded or hidden. The “Today” tab shown in Figure 4-2 provides a quick overview of water consumption, food consumption, exercise, or activity by listing all records belong to these categories created in the current day. The Add buttons provide quick access for the users to add more record. Users can quickly import new data from their wearable device by clicking on the “Sync Now” button without going to the Synchronize menu.

Figure 4‑2: Fitness overview maximized
Fitness History
Unlike the “Today” tab, where all data in a day is presented, the “History” tab (Figure 4-3) visualize fitness data from a date range. Users can select a start and end date where they want to visualize all the records created inside this period. After clicked on the “View History” button, a chart with 2 axes will be generated for each category, such as steps, exercises, meals, waters. This helps users to have a better view over their activities over time.

Figure 4‑3: Fitness activities over time
Sensory Dataset
Another visualization users can use is viewing the dataset as shown in Figure 4-4. While viewing a dataset, users can read all information related to it, such as ID, frequency, activity. Furthermore, they can preview the data in the CSV format and download the full file. Finally, a chat with 2 axes that visualize that data is presented.

Figure 4‑4: View a dataset
Feasibility Study Preparation
The output of this deliverable is in the mean of a demonstration. Beside the screenshots presented in this document, a demonstration video can be found here:
The video was uploaded to the STOP portal and published using the same knowledge management system presented in this document.
Furthermore, the STOP Data and Knowledge Management, Pre-Processing, and User Interaction that was shown here will be re-used in the feasibility study, which is scheduled in the next few months. The system then can be extended and adapted based on the result of this study.
The procedure as well as result of the feasibility study will be reported in another deliverable.

Deliverable D2.2
STOP Data and Knowledge Management, Pre-Processing, and User Interaction layer first release
|
Work Package |
Data and Knowledge Management, Pre-Processing and User Interaction- Component and Service Refinement and Implementation |
|
Task(s) |
|
|
Author(s) |
Binh Vu, Felix Engel |
|
Document ID |
D2.2_ STOP Data and Knowledge Management, Pre-Processing and User Interaction layer first release_M18 |
|
Approver |
Matthias Hemmje |
|
Creation date |
11/08/2020 |
|
Last update |
21/09/2020 |
|
Version |
2020.09.21_final |
|
Supersedes |
NA |
|
Dissemination Level |
PU |
*All dates in dd/mm/yyyy format
Document Log
|
Date |
Author |
Changes |
Version |
Status |
|
11/08/2020 |
Binh Vu |
ToC |
2020.08.11_V1 |
draft |
|
12/08/2020 |
Binh Vu |
Add section 3, 4, 5 |
2020.08.12_V1 |
draft |
|
18/08/2020 |
Felix Engel |
Revision of section 1, 2, and 3 |
2020.08.13_V1 |
draft |
|
18/08/20 20 |
Binh Vu |
Update section 2, 3, 4 |
2020.08.18_V1 |
draft |
|
21/08/2020 |
Binh Vu |
Refer figures in text |
2020.08.21_V1 |
draft |
|
04/09/2020 |
Binh Vu |
Update section 1 |
2020.09.04_V1 |
draft |
|
17/09/2020 |
Binh Vu |
Update section 5 |
2020.09.17_V1 |
draft |
|
21/09/2020 |
Felix Engel |
Edit section 1 |
2020.09.21_final |
final |
Contents
2 Data and Knowledge Management: Cognitive Walkthrough 7
2.1.3 Fitness Data Importing 12
2.1.7 Water Consumption Manager 28
2.2.4 Content and Knowledge Importing 48
2.2.6 Content and Knowledge Searching 54
3 Sensory Data Fusion: Cognitive Walkthrough 55
5 Feasibility Study Preparation 63
Introduction
The STOP project will address the health societal challenge of obesity with the specific objectives of mitigating the enormous and growing Health Care costs of obesity and related health issues. The project proposed solution is the foundation of an innovative platform to support Persons with Obesity (PwO) with better nutrition under the supervision of Healthcare Professionals. Therefore, the STOP Platform will capture various PwO data from different kind of smart sensor streams and Chatbot technology, manage and enrich available data with existing knowledge bases and fuse these by machine learned driven Data Fusion approaches for sophisticated AI data analysis.
The WP2 has a strong relation with other WPs, especially in refining and implementing of the STOP platform architecture which is for convenience as well depicted in Figure 1-1. To provide a better overview of the integration of this report with the architecture, we will shortly summarize some key points. The architecture contains a Persistant Layer (located in the cloud), which consists of a Structured Content area (Digital Library and Multimedia Archive) for the Content and a Knowledge Network (KN) for KOs (details see D2.1). The KM-EP is based on a flexible integration architecture with service harmonization capabilities (an architecture about KM-EP could be found in D2.1).
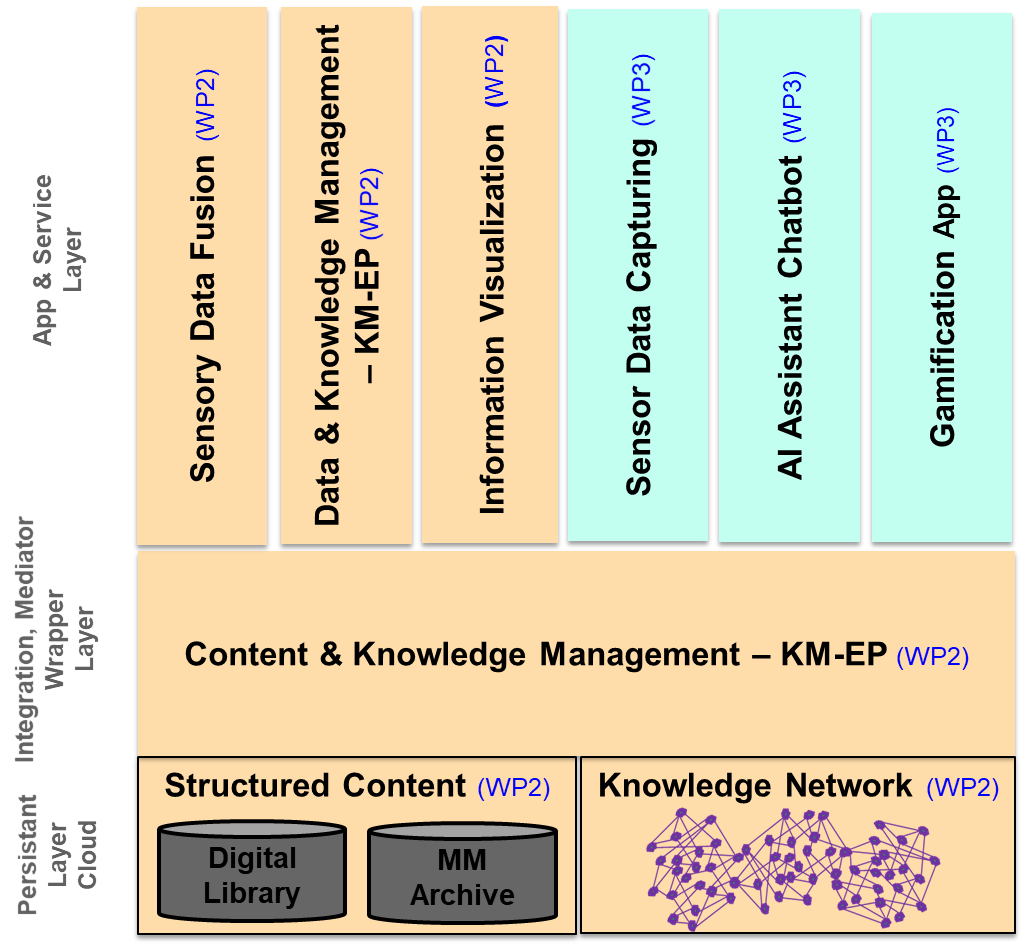
Figure 1‑1: STOP Platform Architecture Data & Knowledge Ecosystem
As marked with different colours in the figure, the platform is combined the works of WP2 and WP3. Overall, the project Work Package 2 (WP2), which is described in this deliverable, is focused on topics related to:
- Sensory Data Fusion: Merging raw data with captured data into KOs
- Data & Knowledge Management – KM-EP: Manages the SDF input and output
- Information Visualisation: Visualise the Content and Knowledge
Other parts of the STOP platform, such as e.g. AI Chatbot and Gamification App, are reported in other deliverables. This report is the second deliverable of the work package 2 with scope on the first STOP Platform release that is conceptualised in the deliverable 2.1 (see Figure 1-2).
Figure ‑: Relation of STOP deliverables
The aim of this report is to document the project achievements to the following objectives:
- O2.2: Conduct software implementation and refinement activities of policies and workflows to enable access and use of data and meta data, managed through the STOP Platform, besides establishing security functionalities, Semantic Data Integration and Fusion.
- O2.3: Conduct software implementation and refinement activities, of innovative Visualisation algorithms and techniques to support case pilot specific user interaction with managed data.
To address the scope of this report and above objectives, project work in WP2 is split in in five tasks. The structure of this report will follow the order of tasks (from DoA) that are already worked in during various secondments. The first four tasks are already relevant for this report and copy and pasted for convenience:
- T2.1 Task lead: CIT. Contributors: FTK, Sensory interfaces Implement an initial selection of sensory interfaces for the STOP Platform. These interfaces will provide a generic approach to engage different types of wearable sensors into the STOP Platform. To be further managed and enriched through the Data Management component. (Secondment No. 2, 12, 23)
- T2.2 Task lead: CIT. Contributors: FTK, Data Fusion Research, selection and integration of machine learning algorithms to be used sensory Data Fusion. (Secondment No. 2, 12, 23)
- T2.3 Task lead: FTK. Contributors: CIT, OKK. Data & Knowledge Management: implementation, refinement and documentation Implementation, refinement and documentation of Semantic Data Integration and Fusion functionalities. This will enable broad subsequent processing and data exchange throughout system barriers and comprehensive Knowledge Management with available data. Actually, the semantic Data Fusion could as well be regarded as a semantic information integration process that enables a unified and unique data access interface. Therefore, amongst others a formal extensible ontology will be developed and validated to represent the relevant concepts and relations of the food domain. Address ethical implications that goes along with the platform implementation and refinement of workflow and access functionalities. (Secondment No. 3, 7, 25)
- T2.4 Task lead: OKK. Contributors: CIT, FTK. Visualisation: Implementation, refinement and documentation. An intuitive visualisation dashboard will be designed that is personalised to each user. The visualisation will complete the loop in the quantified-self paradigm by enabling effective feedback for reflection, planning, actionable insights and for self-understanding. The visualisation will be co-designed with users to ensure that it is useful and user-centred. The visualisation will be interactive in nature and will allow the user to interrogate the data on multiple levels of detail where the sophistication and granularity is controlled by the user. Interpretation of the visualisation will be validated using the concurrent think-aloud protocol otherwise known as a cognitive walkthrough with users. Finally, the visualisation will be audited using design principles and heuristics from Gestalt psychology. (Secondment No. 8 & 13).
The report documents four cognitive walk through of the Platform components Data and Knowledge Management, Sensory Data Fusion, and Data Visualisation. Each walkthrough demonstrates stepwise the functionality of the system components with screenshots and their descriptions.
Data and Knowledge Management: Cognitive Walkthrough
In this section, the Data and Knowledge Management developed in the context of the STOP project is presented. The walkthrough is split into a description of the data management functionality for the management of fitness data and a section that reports on the functionality for knowledge management.
Fitness Data Management
Fitness Data Manager supports users in the task of importing, creating, and managing their fitness data. They consist of several modules that helps to manage users’ activities, exercises, food and water consumptions, weights, and goals.
User Registration
Go to the STOP portal at https://stop.projekt.onl/. Users are required to login using their username and password. Unregistered users click on “Register” button to go to the registration page (see Figure 2‑1).

Figure ‑: User registration UI
Users will need to fill in their personal information and choose a username and password to complete the registration process. All optional and required fields are presented in Figure 2‑2.

Figure ‑: User registration form
Fitness Overview
After completed registration and login using username and password, users are required to create a fitness profile. This step is needed for the system to calculate a personalized fitness plan for each user (Figure 2‑3).
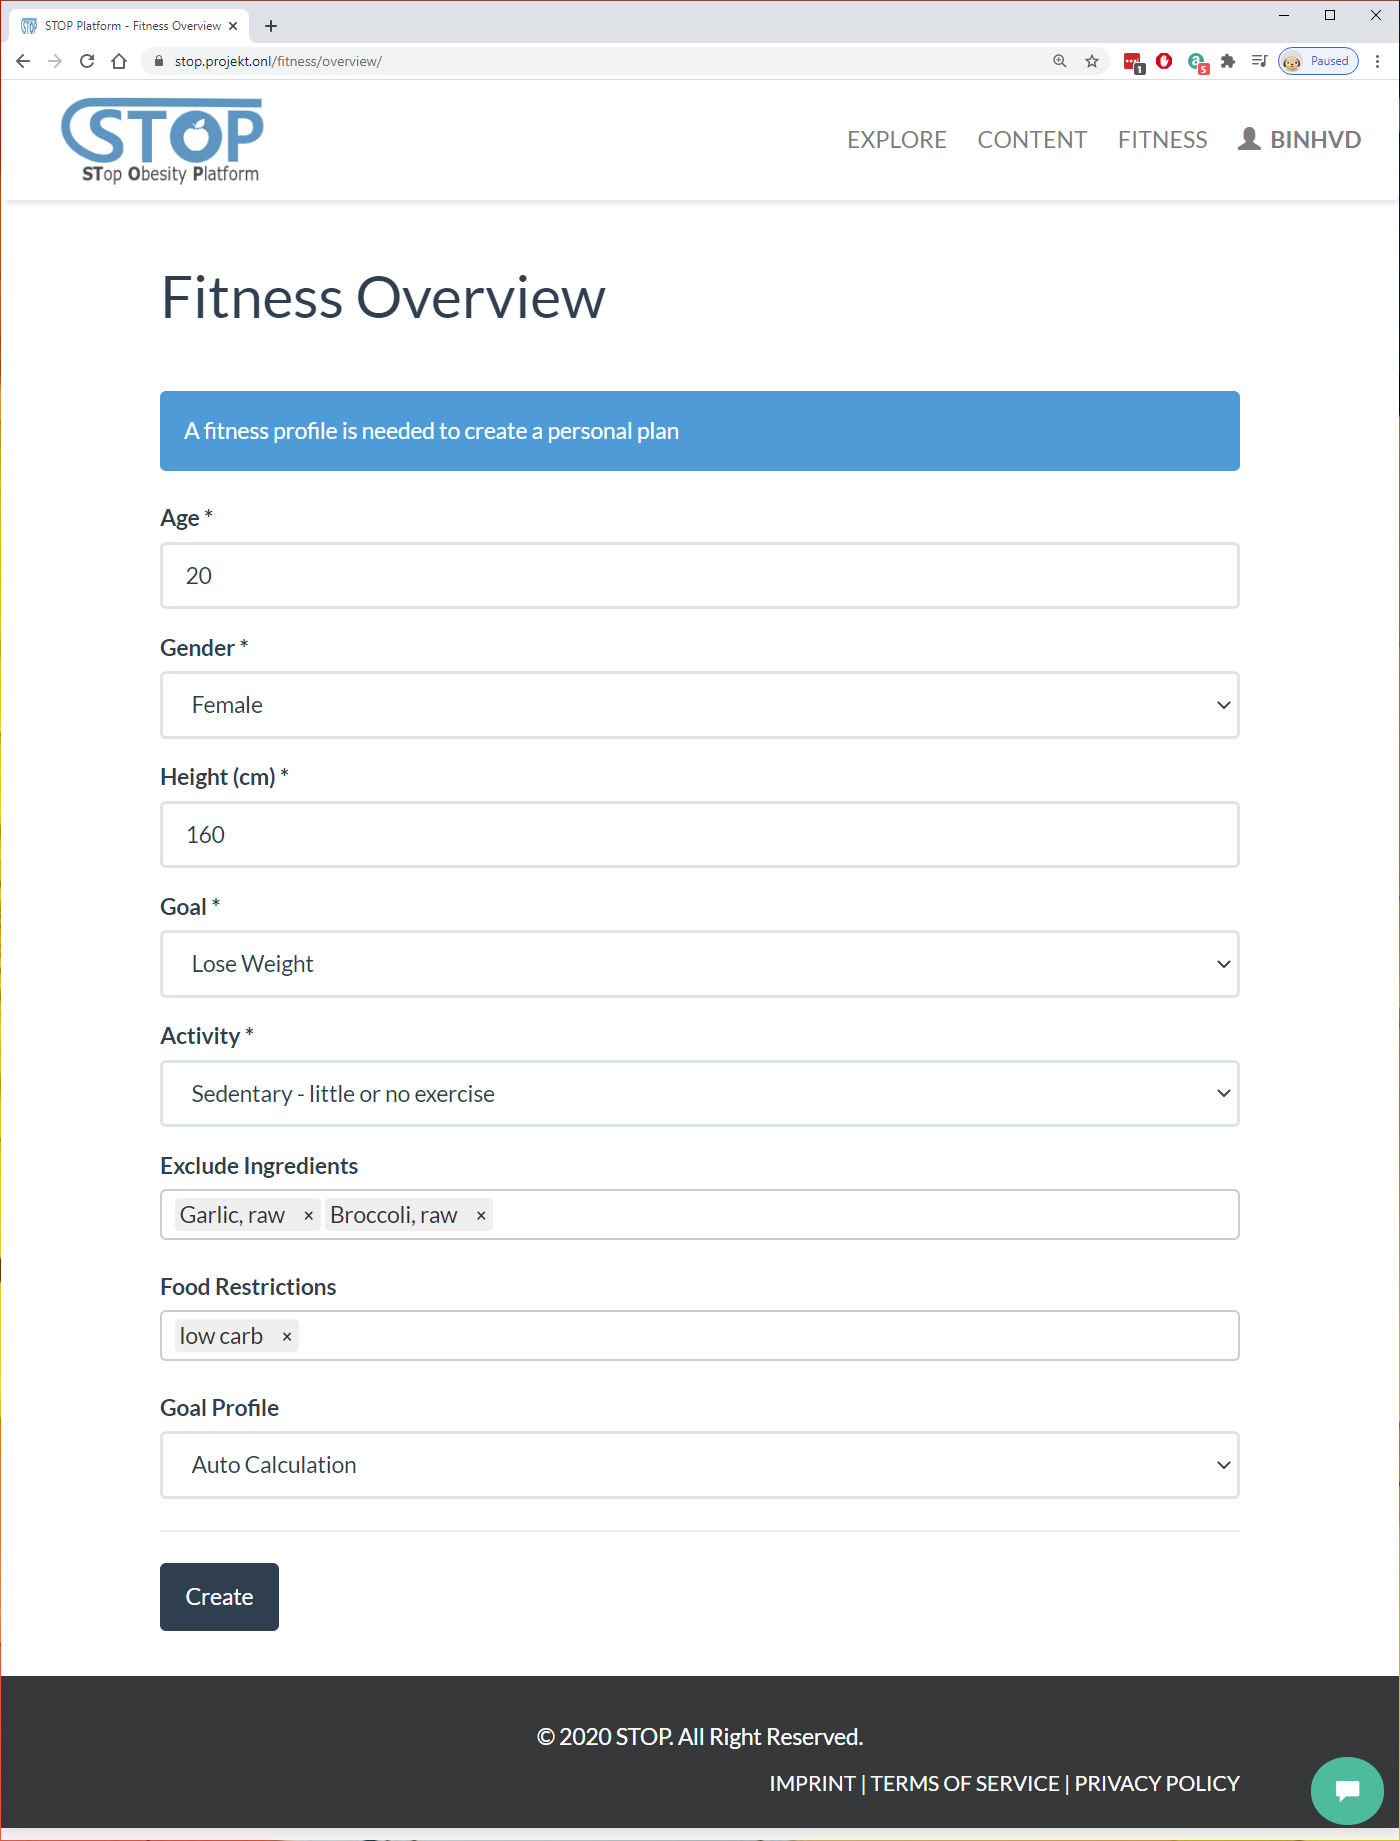
Figure ‑: Create a fitness profile
The fitness profile also requires user’s current weight. The current weight could be added through the form shown in Figure 2‑4.

After the fitness profile was created, user can edit it by going to menu Fitness > Overview on the navigation bar. Figure 2-5 shows the editing form.

Figure 2‑5: Edit fitness profile
Fitness Data Importing
Users have the possibility to import their fitness data from a wearable device. By going to menu Fitness > Synchronize > Fitbit, users can access and import data from any Fitbit device (Figure 2-6).

Figure 2‑6: Import from Fitbit
Users will need to authorize the STOP portal to access their fitness data by logging in using their Fitbit account. Figure 2-7 presents Fitbit’s login interface.

Figure 2‑7: Login Fitbit account
After authorized the STOP portal, users will be redirected back to the portal. Here, they can choose to access to new data created since the last import. If users haven’t import data from this service before, the system will suggest to load all data created from the last 3 months.
Users have the option to change the import date then click on the “Load New Records” button to download their fitness data (Figure 2-8).

Figure 2‑8: Load data from Fitbit
After loading fitness data from Fitbit, users can preview them. There are 6 types of fitness data loaded: Activities, Exercises, Weights, Foods, Waters, and Goals. As shown in Figure 2-9, users can click on the “Activities” tabs to browse the activity records. They can also search for specific record by using the search box.

Figure 2‑9: List loaded activities
Similar to activity, users can browse exercise records in the “Exercises” tab. The related data for each exercise is shown in Figure 2-10.

Figure 2‑10: List loaded exercises
Users can look at their weight-related data each day in the “Weights” tab as shown in Figure 2-11.

Figure 2‑11: List loaded weights
If users enter their food consumption, such as food name, consumption time… to their Fitbit account, it will be listed in the “Foods” tab (Figure 2-12).
The same applies to water. It will show how much water user drank each day.

Figure 2‑12: List loaded foods
Finally, the last tab shows the target users added or calculated by Fitbit based on the users’ fitness profile (Figure 2-13).

Figure 2‑13: List loaded goals
After viewing all their data, users click on “Synchronize” button at the end to import them to the STOP portal. The system will show how many records were imported successfully as in Figure 2-14.

Figure 2‑14: Import data successfully
Activity Manager
After fitness data was imported, users can manage their data in the “Fitness” menu. To manage activity data, users can go to Fitness > Activities menu. In Figure 2-15, all activity records are listed. Users can either edit existing records by clicking on “Edit” button or create a new activity by clicking on “Add Activity”.

Figure 2‑15: List created activities
In the “Add/Edit Activity” page as shown in Figure 2-16, users need to fill out the required fields, such as “Log Date”. Other fields, such as “Log Time”, “Distance”, “Steps”, are optional. After filling out all the information, users click on “Create/Save” to create a new activity or save the edited record. Furthermore, users can also click on “Cancel” button to come back to the listing page.
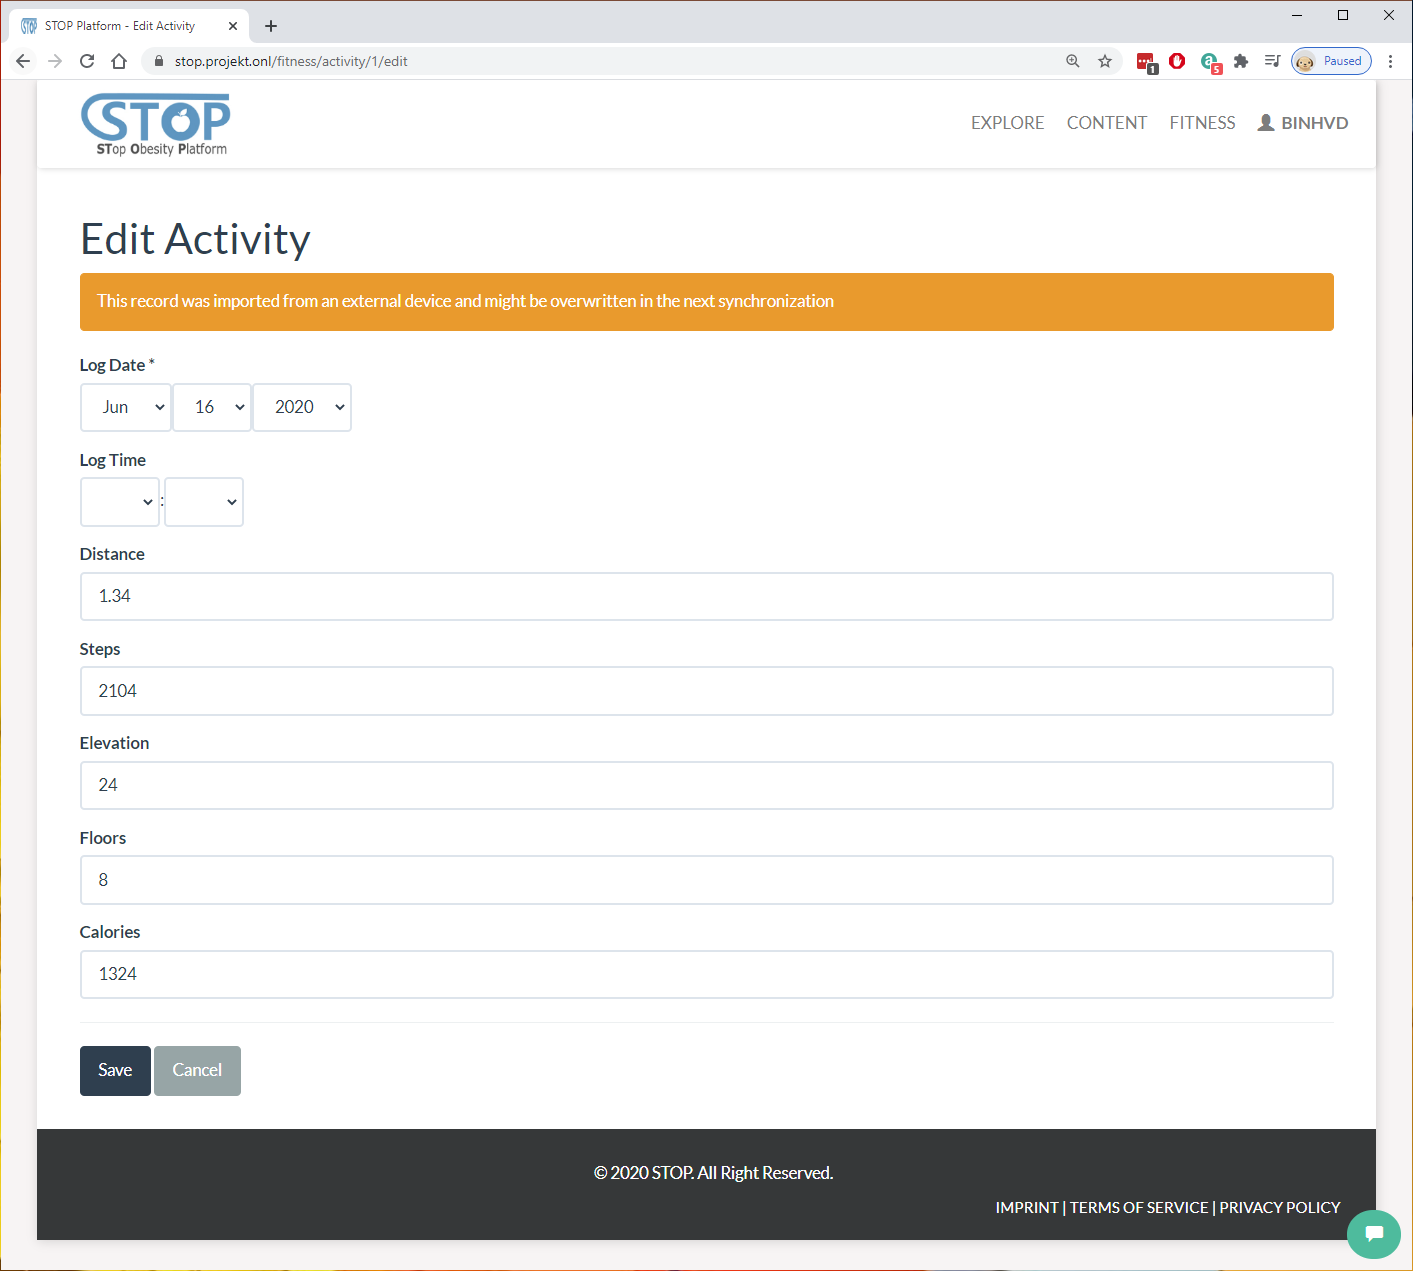
Figure 2‑16: Edit an activity
On the listing page, users click on the “Delete” button of a record to remove this record from the database. The system will ask for users’ confirmation to make sure that they have not clicked on this button by mistake (Figure 2-17).

Figure 2‑17: Delete an activity
Exercise Manager
Next to “Activities” menu is the “Exercises” menu, where users can manage their exercise records (Figure 2-18). Similar to “Activities”, users can click on “Edit” button to edit existing record or “Add Exercise” button to create a new exercise.

Figure 2‑18: List created exercises
In the “Add/Edit Exercise” page shown in Figure 2-19, users will need to fill out the information related to their exercise, such as name, date, description, distance, etc. After completed this step, users click on the “Create/Save” button to save the input to the database. Users can stop this process and go back to the listing page anytime by clicking on the “Cancel” button.

Figure 2‑19: Edit an exercise
On the listing page, users can delete a record by clicking on the “Delete” button at the end of the row. Figure 2-20 shows the system asking users once more time before removing the record from the database.

Figure 2‑20: Delete an exercise
Meal Manager
Users can manage their food consumption by selecting Fitness > Meals menu (Figure 2-21). Here they can ask the system to suggest a recipe for their next meal or add a meal that they just ate. Furthermore, users can edit the created record in the list.

Figure 2‑21: List created meals
In the “Add/Edit Meal” page in Figure 2-22, users will need to add the food they ate in the meal then click on the “Create/Save” button to save the input to the database. Otherwise, users can stop this process and go back to the listing page anytime by clicking on the “Cancel” button.

Figure 2‑22: Add a meal
Similar to other type of data, users can delete a meal record by clicking on the “Delete” button at the end of the row. The system will need users’ confirmation once more time before removing the record from the database as shown in Figure 2-23.

Figure 2‑23: Delete a meal
Water Consumption Manager
Users can manage their water consumption by selecting Fitness > Water menu. Here they can add a drink record to the system or edit the added drink in the list shown in Figure 2-24.

Figure 2‑24: List created water consumptions
In the “Add/Drink Water” page as shown in Figure 2-25, users fill out the timestamp and volume of the drink then click on the “Create/Save” button to save it to the database. Otherwise, users can stop this process and go back to the listing page anytime by clicking on the “Cancel” button.

Figure 2‑25: Drink water
In the listing page, users can delete a drink by clicking on the “Delete” button at the end of the row. The system will ask users if they are sure before removing the drink from the database (Figure 2-26).

Figure 2‑26: Delete a water consumption
Weight Manager
In the Fitness > Weights menu, users can manage the changes of their weight over time. Here they can add, edit, or delete their weight records. Figure 2-27 shows the list of user’s weight records.

Figure 2‑27: List created weight records
In the “Add/Edit Weight” page in Figure 2-28, users type in their weight along with BMI and Fat value then click on the “Create/Save” button to save them to the database. Users can also click on the “Cancel” button to stop this process and go back to the listing page.

Figure 2‑28: Add a weight record
In the listing page presented in Figure 2-29, users can delete a record by clicking on the “Delete” button at the end of each row. The system will ask users if they are sure before removing the record from the database.
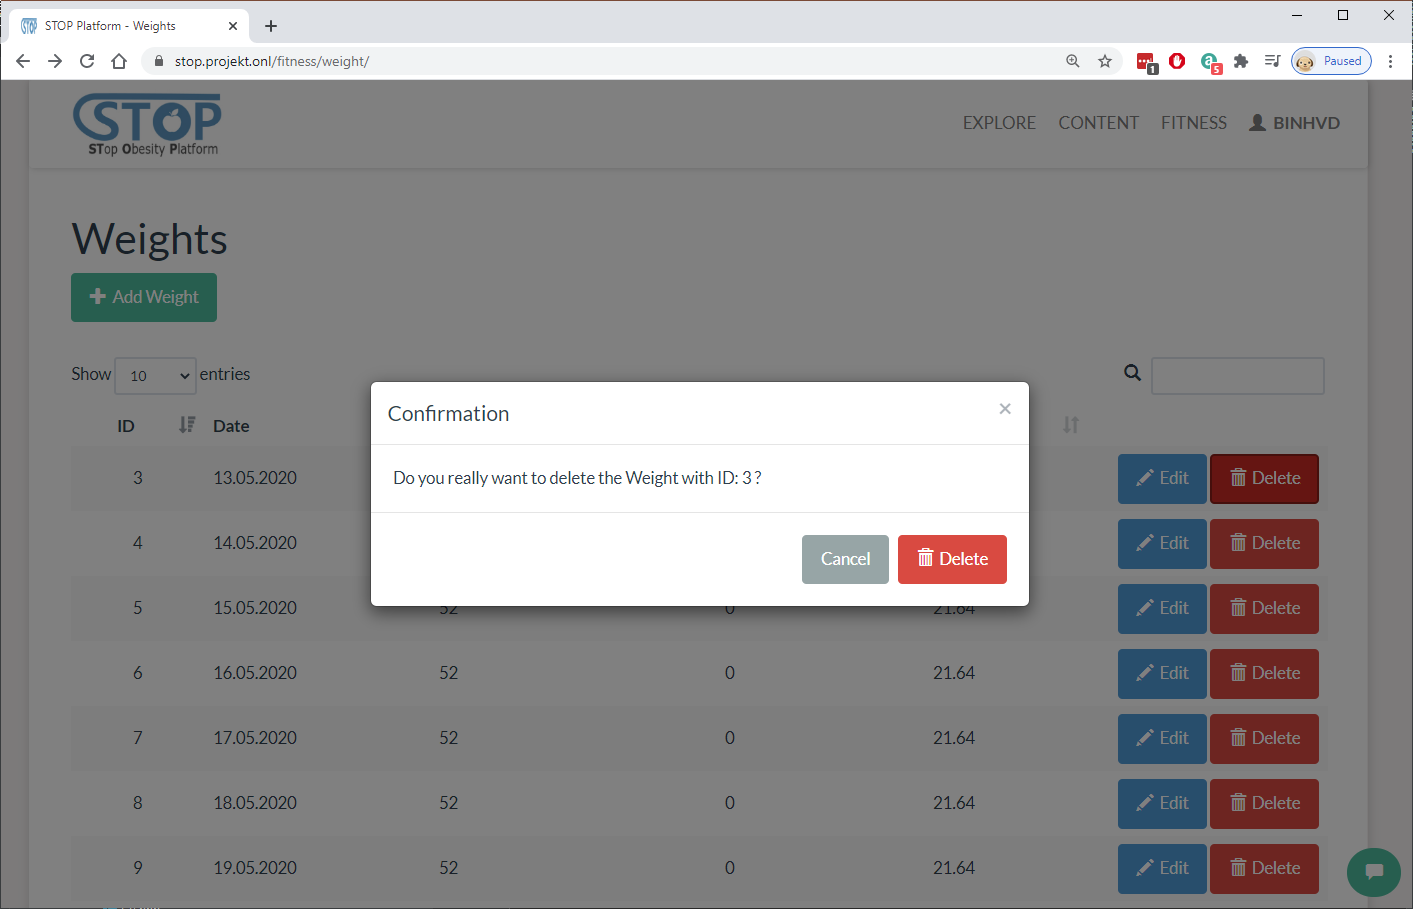
Figure 2‑29: Delete a weight record
Goal Manager
Finally, users can manage their fitness goals by going to the Fitness > Goals menu. Here, goals imported from fitness services and created by the users in the portal are listed. Users can create, edit, or delete them from the database as illustrated in Figure 2-30.

Figure 2‑30: List created goals
In the listing page, users can delete a goal by clicking on the “Delete” button at the end of each row. Figure 2-31 shows the system asking users if they are sure before removing the goal from the database.

Figure 2‑31: Delete a goal entry
After clicking on “Edit” or “Add Goal” button, users will be directed to the “Add/Edit Goal” page. Here, users fill out the needed information then click on the “Create/Save” button to save them to the database. Furthermore, users can click on the “Cancel” button to go back to the listing page as shown in Figure 2-32.
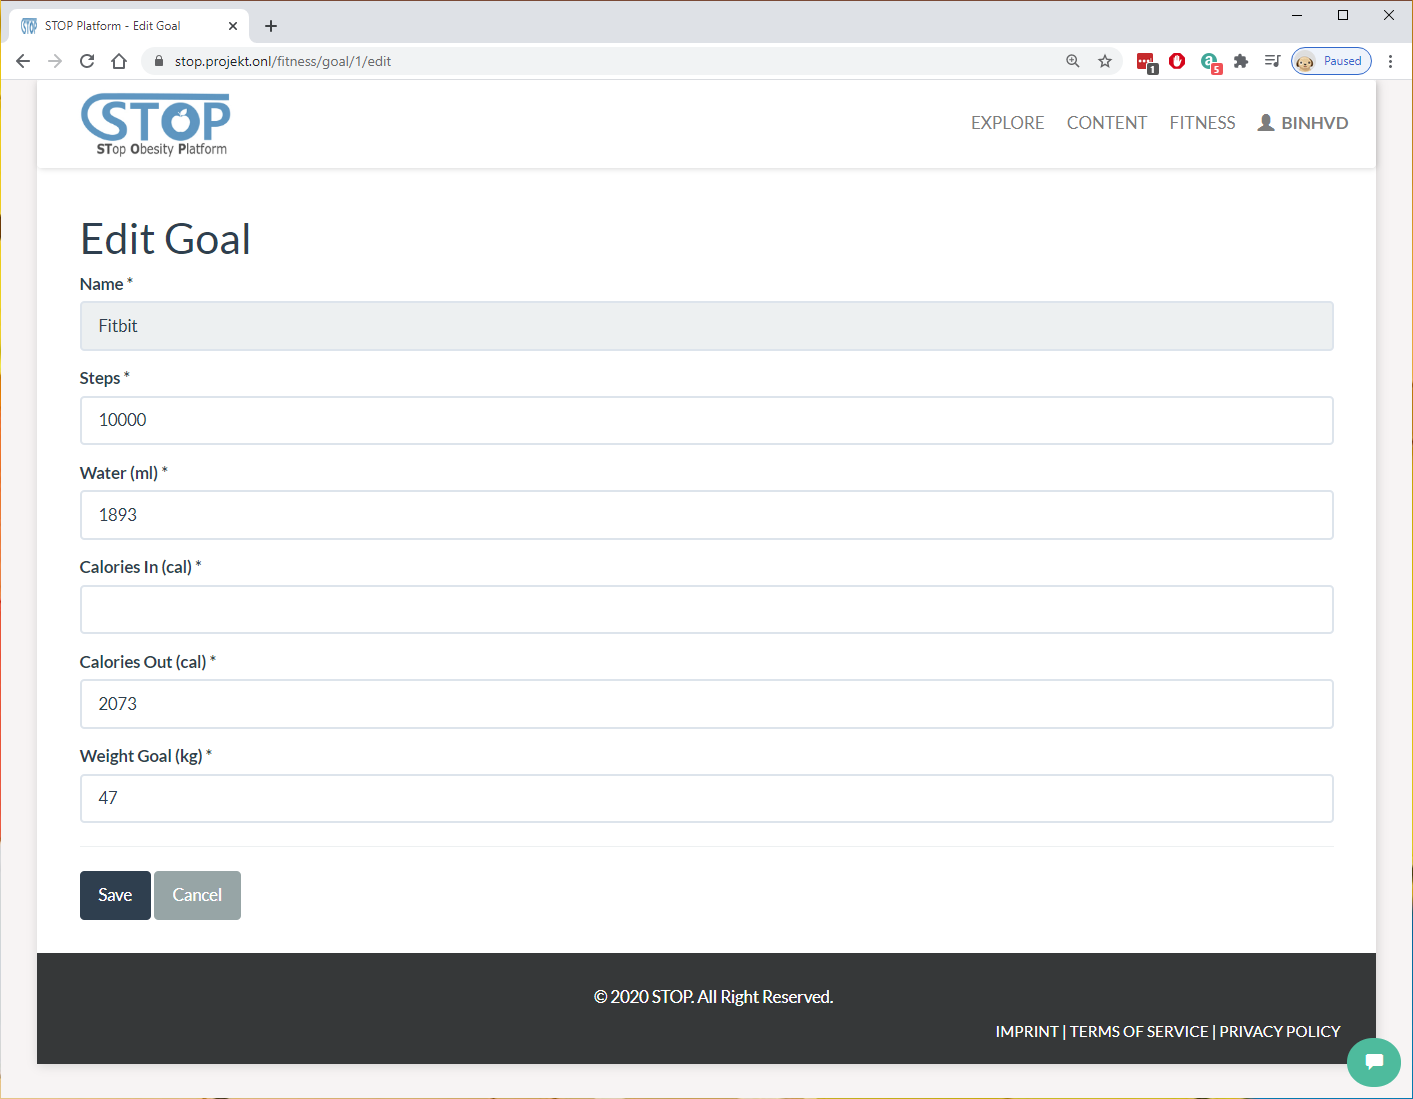
Figure 2‑32: Edit a goal entry
After new goals were created, users can select between them and “Auto Calculation” in the Fitness Profile anytime (Figure 2-33). This will change the user’s target for each day in the Fitness Overview visualization.

Figure 2‑33: Change goal profile
Knowledge Management
This system manages all content and knowledge in the STOP portal. New content and knowledge can either be created by the users or imported from external files and services.
Publication Manager
Users can manage publications in the Content > Publication menu. Here, they can create, edit, and delete publication records in the database. Users can also view a publication by clicking on its title. Figure 2-34 shown the management page.

Figure 2‑34: List created publications
In the Adding/Editing page in Figure 2-35, users need to fill out the metadata for the publication. The metadata is split into several groups, such as authors, identifiers, publishers, etc. In “Multimedia” group, users are able to upload and manage PDF files for the publication.
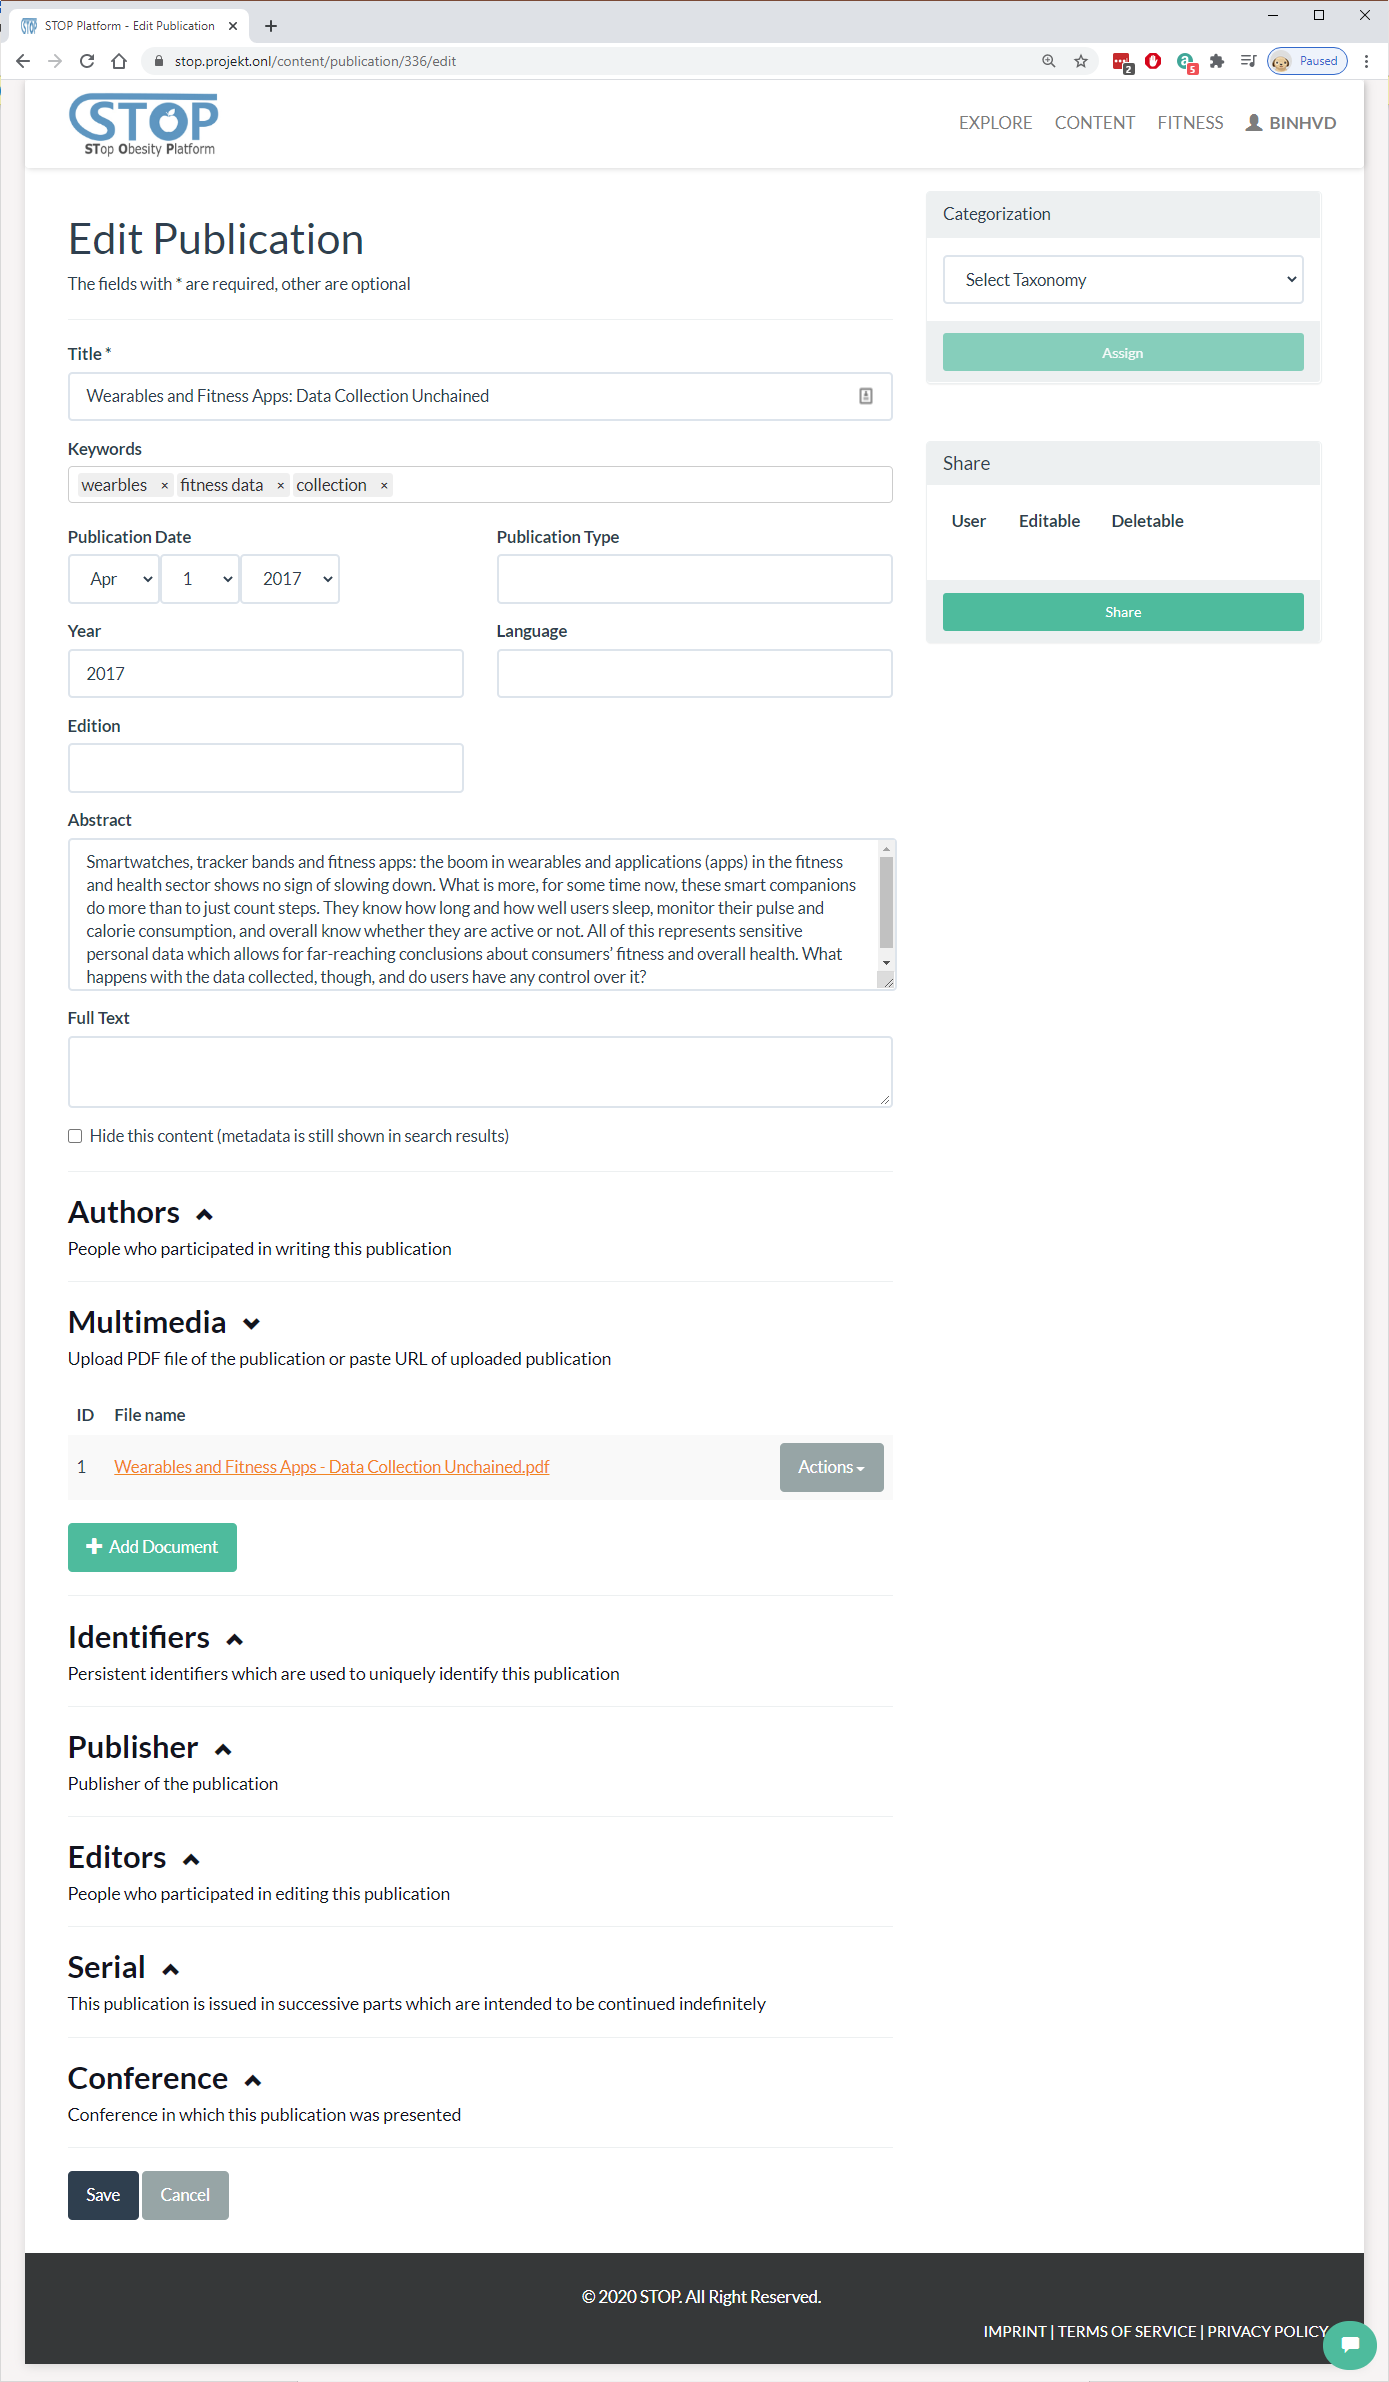
Figure 2‑35: Edit a publication
In the listing page, users can delete a publication by clicking on the “Delete” button at the end of each row. The system will ask users if they are sure before removing the publication from the database (Figure 2-26).

Figure 2‑36: Delete a publication
In figure 2-37, the “Content Display” page shows the metadata and download a publication. Here, users can view related information such as title, authors, description, etc. Furthermore, they can rate the quality of the publication as well as share it on the social networks.
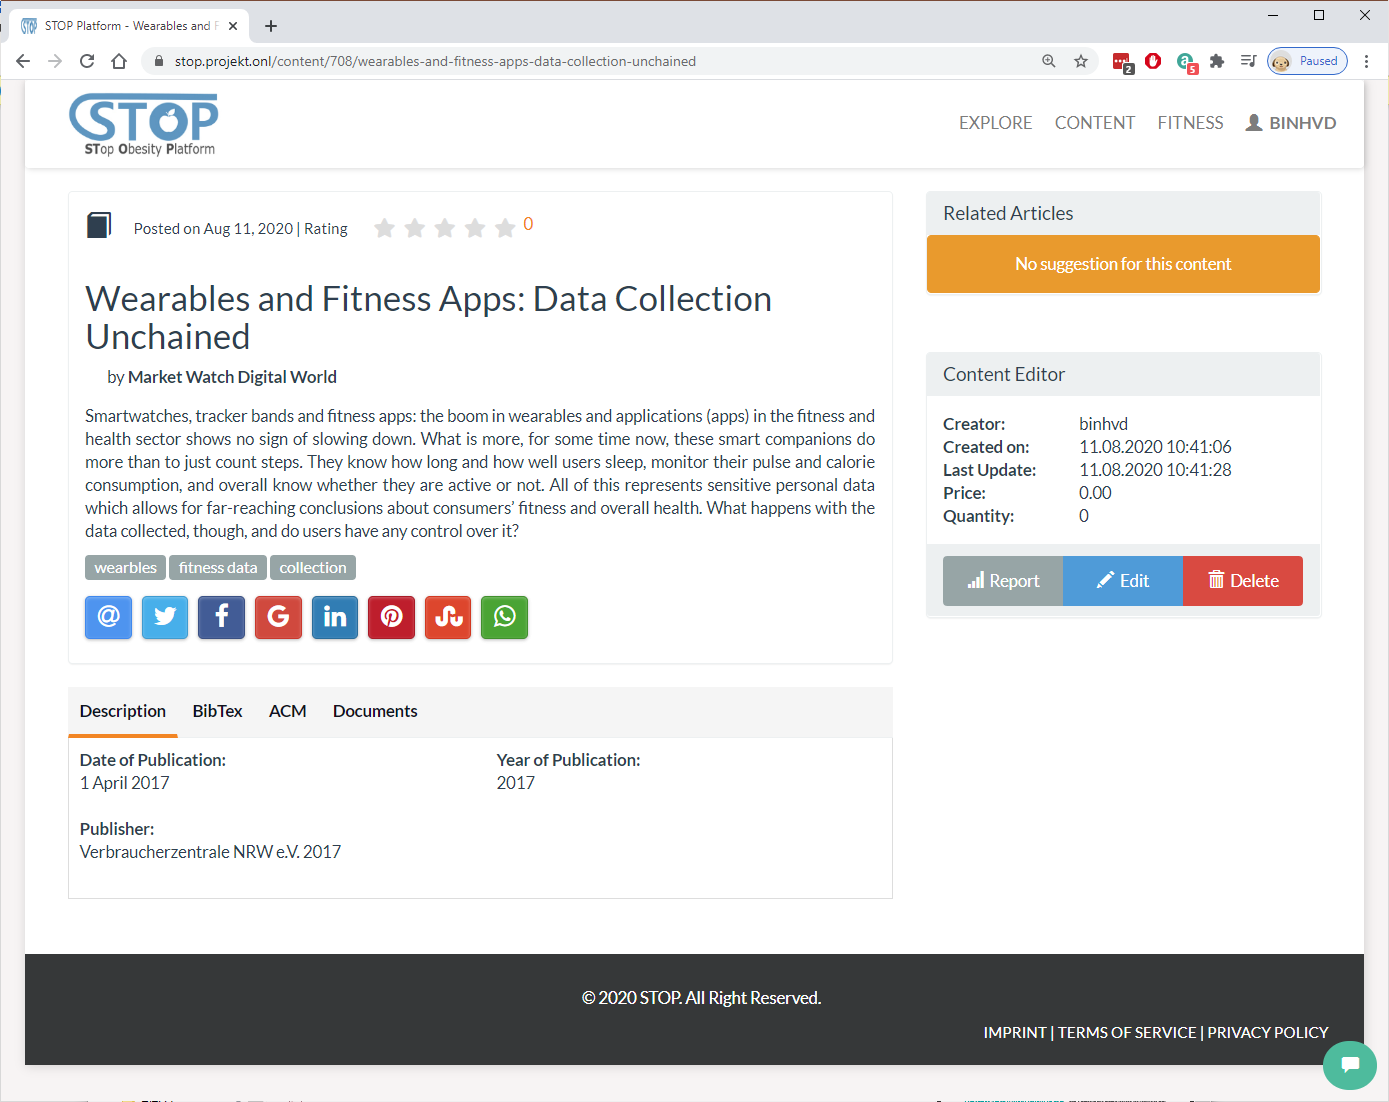
Figure 2‑37: View a publication
Multimedia Manager
Users can manage multimedia in the STOP portal by selecting the Content > Multimedia menu. Figure 2-38 illustrates the record list. Here, they can create, edit, and delete multimedia records in the portal. Users can also view a multimedia’s metadata and download it by clicking on its title in the listing table.

Figure 2‑38: List created multimedia
After clicking on the “New Multimedia” or “Edit” button, users are directed into the “New/Edit Multimedia” page as shown in Figure 2-39. Similar to Publication, users need to fill out multimedia metadata and upload data here. There are different types of multimedia, such as video, presentation, audio, zip. Depend on the multimedia type, users will be able to upload different data.
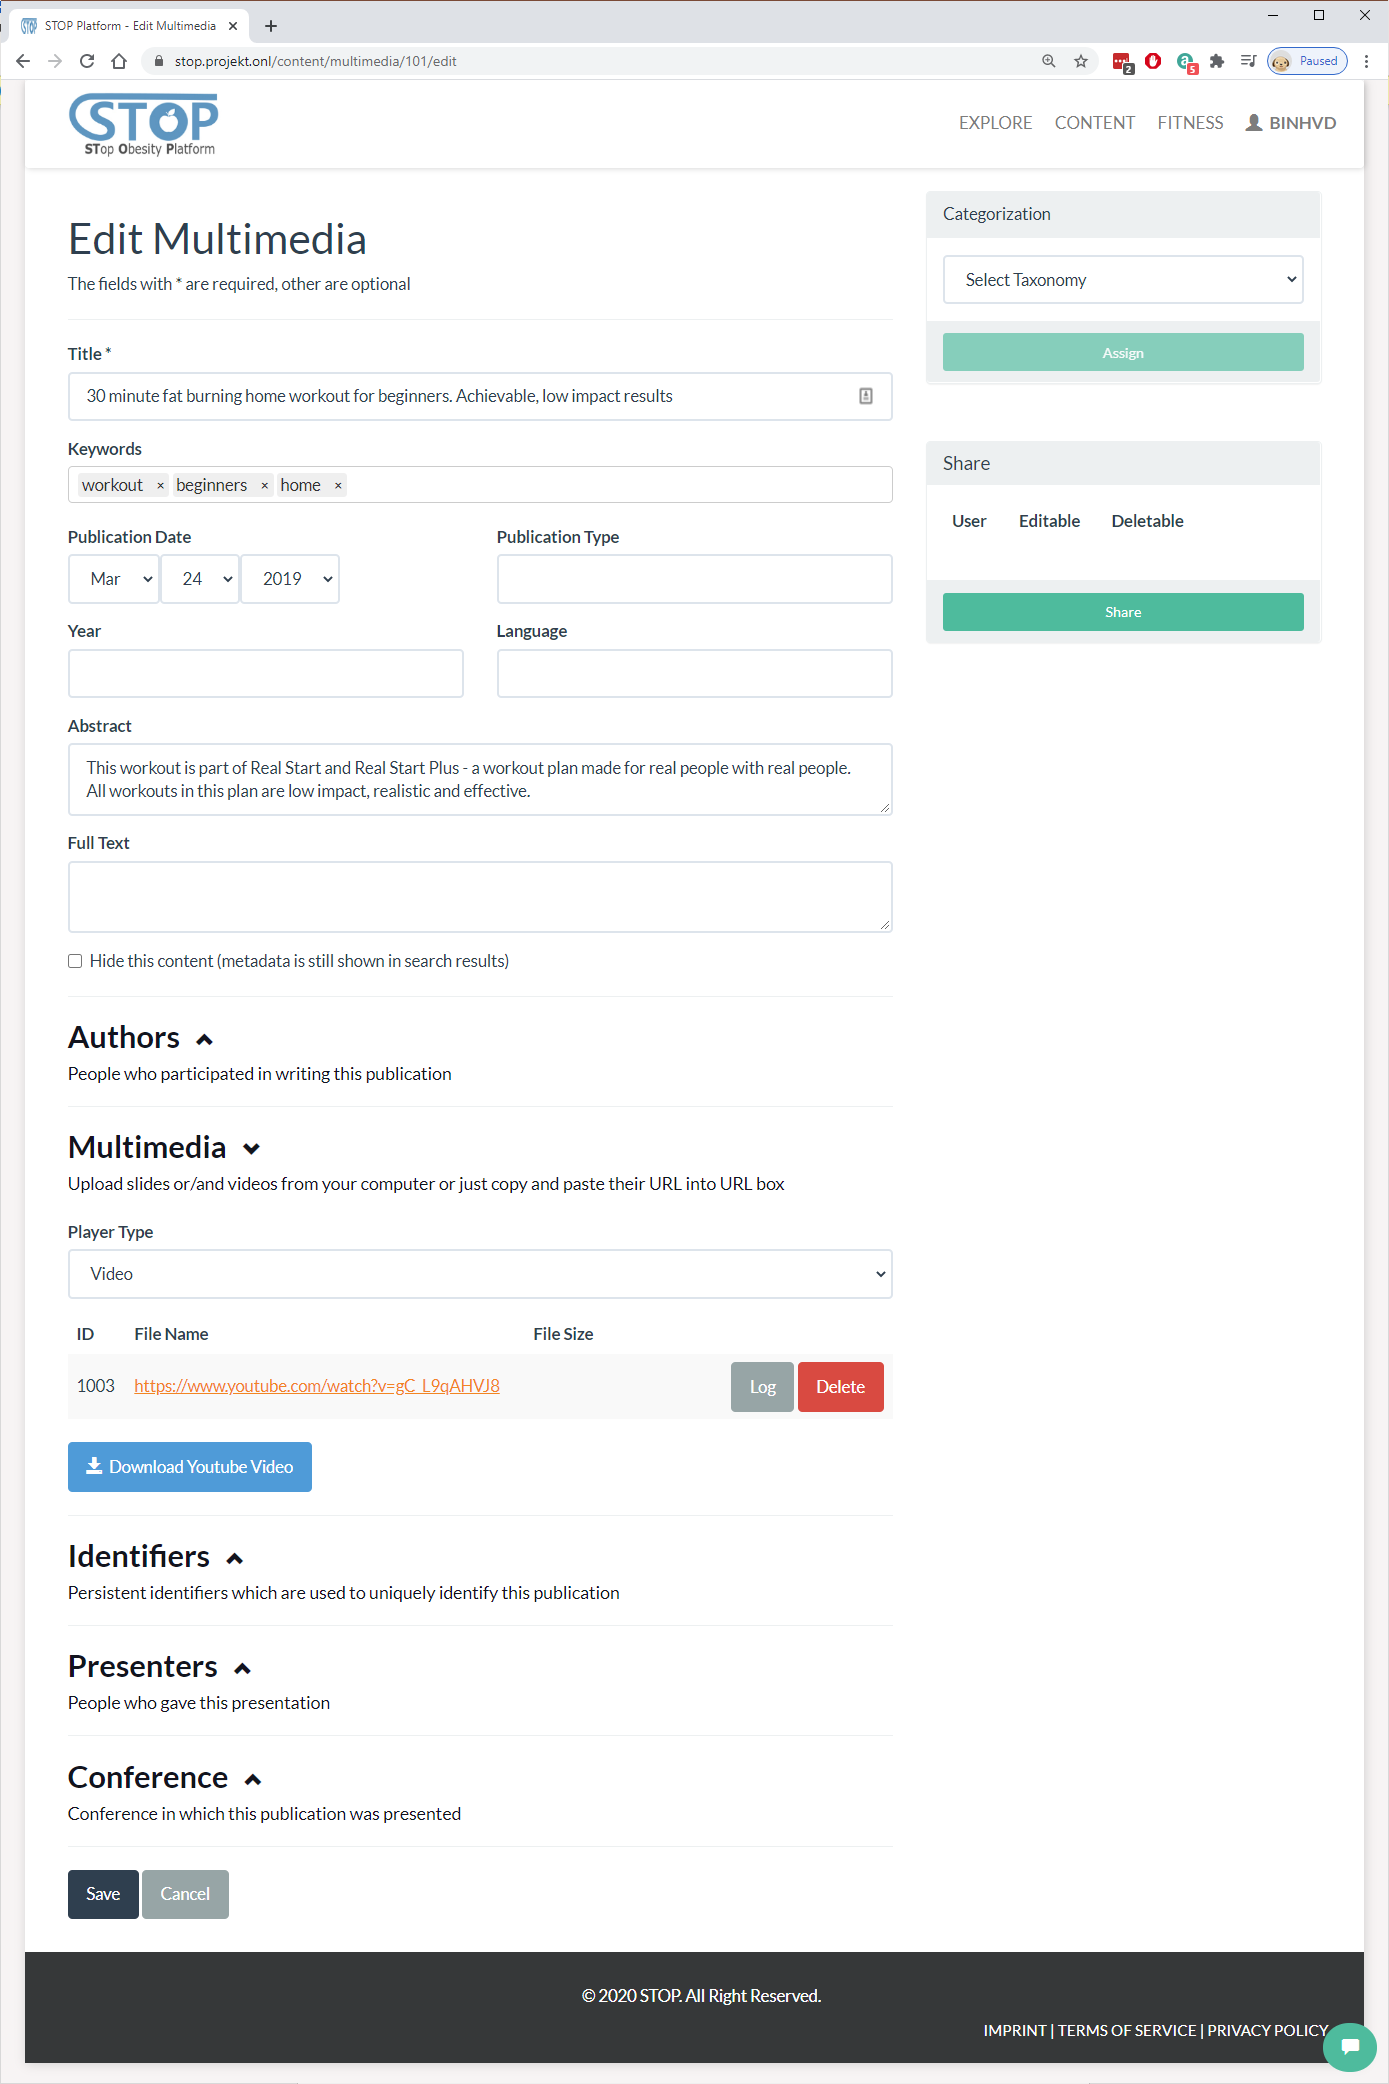
Figure 2‑39: Edit a multimedia
In the listing page, users can delete a publication by clicking on the “Delete” button at the end of each row. Figure 2-40 shows the system asking users if they are sure before removing the publication from the database.

Figure 2‑40: Delete a multimedia
Users are able to look at a multimedia metadata and download or play it content in the “Content Display” page as presented in Figure 2-41. Here, users can read important information such as multimedia title, description, authors, etc. Furthermore, they can also rate this content and share it on different social networks.

Figure 2‑41: View a multimedia
Taxonomy Manager
Taxonomy is an important type of content that allows users to use it to classify content in the STOP portal. To manage taxonomies, users need to go to the Content > Taxonomy menu. In figure 2-42, taxonomies created by the users are listed for viewing, editing, and deleting. Furthermore, users can create new taxonomy by clicking on the “New Taxonomy” button.
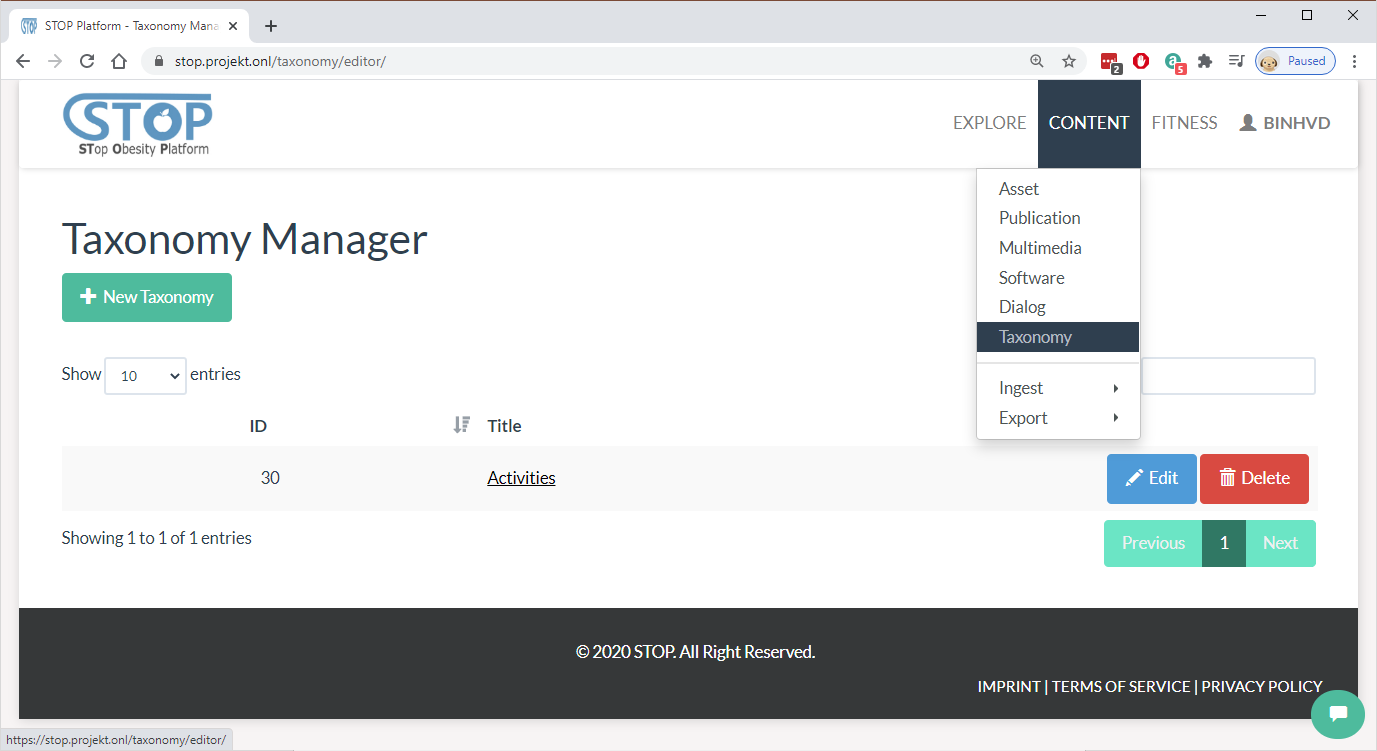
Figure 2‑42: List created taxonomies
In the “New/Edit Taxonomy” page, users are able to create a new taxonomy or edit an exiting taxonomy (Figure 2-43). Users will need to fill out the related information such as taxonomy title, keywords, description, and authors. In the “Structure” tab, users are provided with a taxonomy building tool that supports user in the construction and management of a taxonomy.

Figure 2‑43: Edit a taxonomy
In the listing page, users can delete a publication by clicking on the “Delete” button at the end of each row. The system will ask users if they are sure before removing the publication from the database. Figure 2-44 presents the deleting page.

Figure 2‑44: Delete a taxonomy
Figure 2-45 presents the “Taxonomy Display” page, where users can view the metadata of a taxonomy, its structure, and are able to export it into different formats. Similar to publication and multimedia, users can see the current rating of the viewing taxonomy and rate it by selecting the stars in the top of the page. They are also able share the content on social networks. In the right panel, the system will suggest content that is similar to the viewing taxonomy.

Figure 2‑45: View a taxonomy
Content and Knowledge Importing
Content can be imported from different formats, such as BibTex and OAI-PMH, and external services, such as Mendeley, SlideShare, GibHub, StackExchange, DSpace, and Youtube, to the STOP portal. To do so, users need to go to the Content > Ingest menu. Here, they can select one of the services to start the import process (Figure 2-46).

Figure 2‑46: Import a question from StackExchange
After choosing the content that needs to be imported, the system will direct users to the Import Wrapper Manager (Figure 2-47). It is where the mapping table, which tells the import system which fields from the external service can be copied to which fields in the STOP database, is managed. Here, users can change, delete, import, and export the mapping setting. After making sure the mapping is correct, users click on the “Import” button to start the importing process.

Figure 2‑47: Edit StackExchange’s wrapper
Dialog Manager
Dialog (questions and answers) can be imported from the StackExchange service. After that, they can be managed in the Content > Dialog menu. Here, users can create new dialog, edit existing records, or delete them as presented in Figure 2-48. Users can also read a dialog by clicking on its title or search for dialogs using the searching box.

Figure 2‑48: List created dialogs
Figure 2-49 shows the “New/Edit Dialog”, where users can create/edit a question by entering its title, keywords, and content. The system allows some forms of simple HTML, such as p, li, strong, etc. Users click on the “Save” button to complete the creating/editing or the “Cancel” button to stop the process and go back to the listing page.

Figure 2‑49: Edit a dialog
In the listing page, users can delete a dialog by clicking on the “Delete” button at the end of each row. Figure 2-50 illustrates the final step where the system asking users if they are sure before removing the dialog from the list.

Figure 2‑50: Delete a dialog
In Figure 2-51, users can look at the questions and answers of a dialog. They can also see the upvotes for each answer and the question itself. Furthermore, users have the option to upvote or downvote an answer and the question. The timestamp and author of each answer and question are also displayed for the viewer. Finally, users can provide their answers for the posted question.

Figure 2‑51: View a dialog
Content and Knowledge Searching
Content in the STOP portal is categorized and can be searched by the users. The searching page can be reached by clicking on the “Explore” menu. As present in Figure 2-52, users can enter the searching term then clicking on the “Search” button to start the searching process. After the search result is presented to the users, they can apply filters, such as publication year, type of content, or categorization, for a narrower search result.
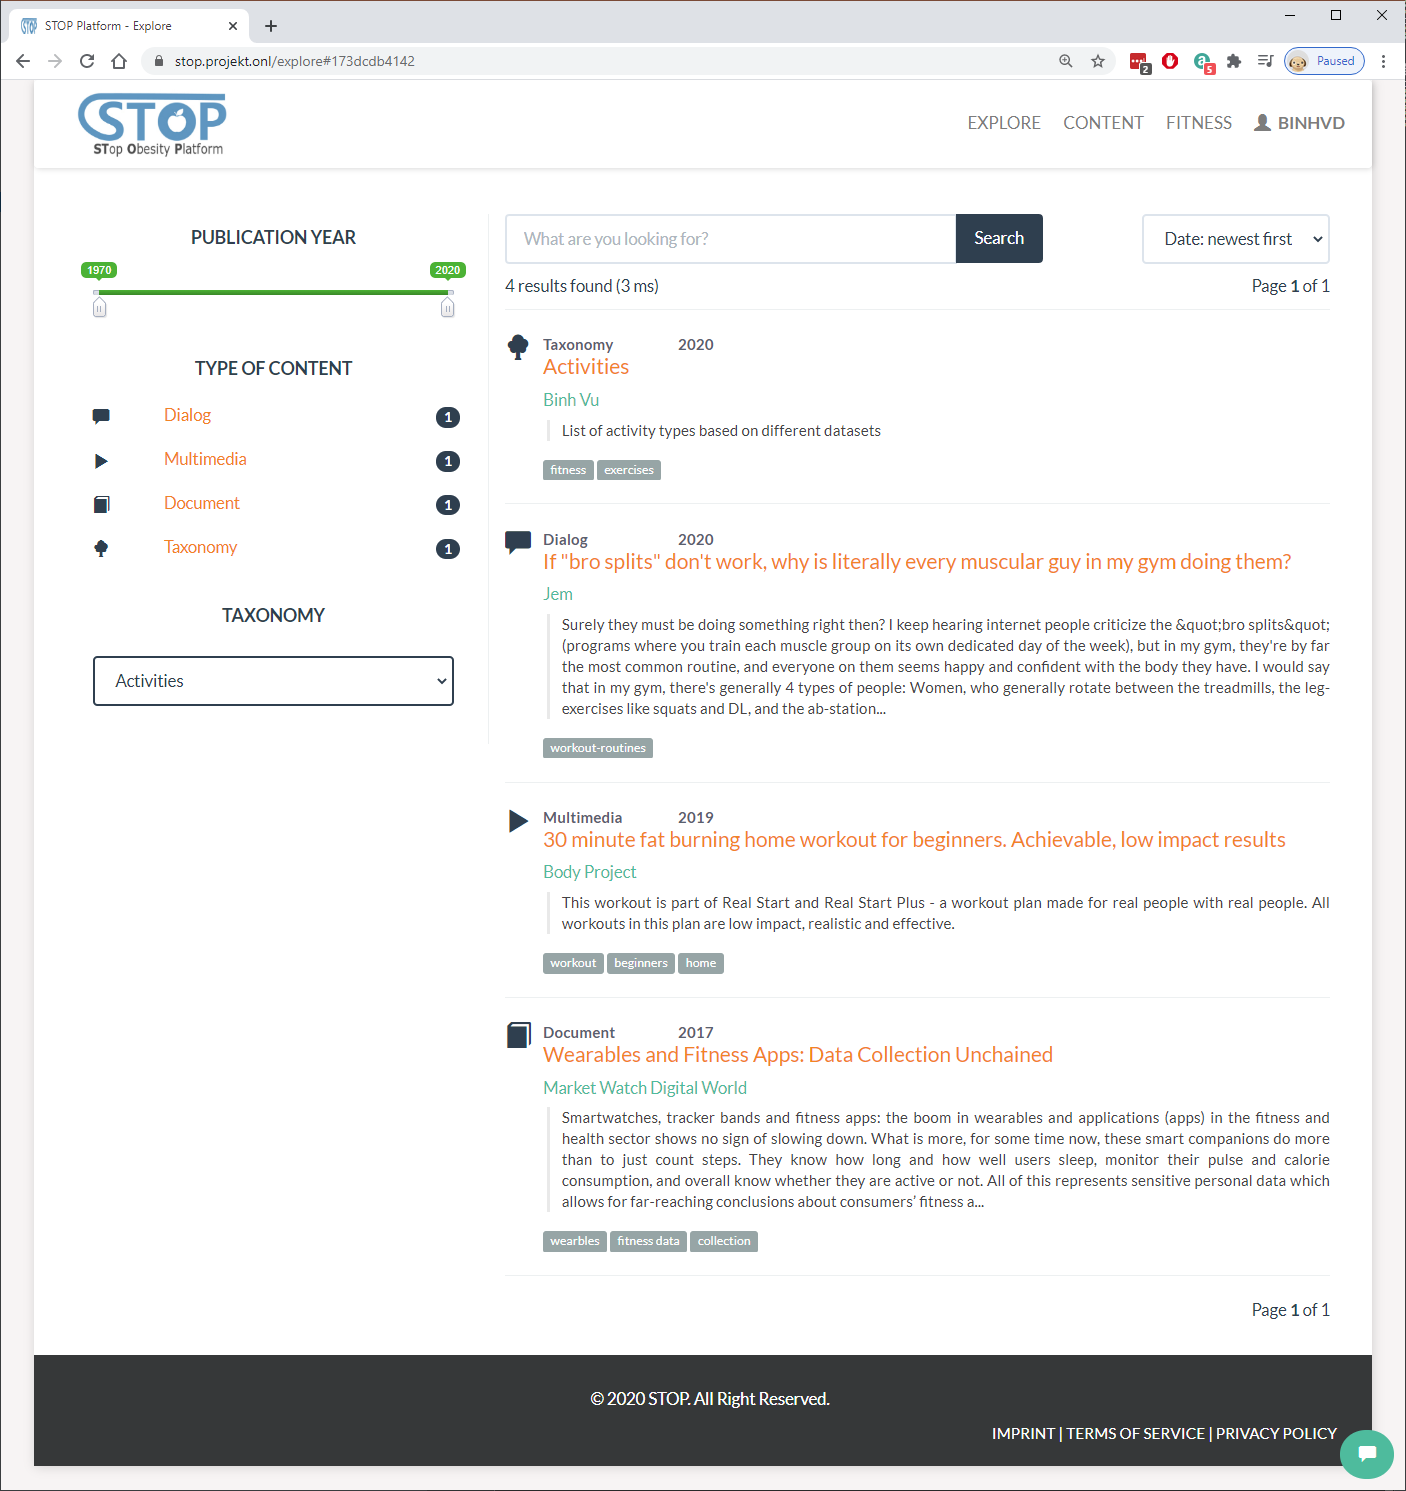
Figure 2‑52: Search for content
Sensory Data Fusion: Cognitive Walkthrough
In this section, the sensory Data Fusion developed in the STOP project is introduced. The system’s first release is presented in a cognitive walkthrough where its features and functionalities are described in a series of screenshots and descriptions.
Sensor Manager
Users can manage their sensors by going to the Fitness > Sensors menu. Here the list of all sensors is shown to the viewer (Figure 3-1). Simple information such as the ID of the sensors, their positions, and the number of datasets for each sensor are displayed. Users have the option to add new sensors, view their datasets, or delete sensors from the list.

Figure 3‑1: List created sensors
In the adding page, users need to choose the position of the new sensor then click on the “Create” button. They can also click on the “Cancel” button to cancel the process and go back to the listing page as shown in Figure 3-2.

Figure 3‑2: Add a new sensor
In the listing page, users can delete a sensor by clicking on the “Delete” button at the end of each row. The system will ask users if they are sure before removing the sensor from the list (Figure 3-3).

Figure 3‑3: Delete a sensor
Dataset Manager
In the dataset listing page presented in Figure 3-4, users can browse and search for datasets of a chosen sensor. The list shows all datasets belong to a sensor including their IDs, created dates, frequencies, and activities. Users have the option to add new datasets, view them, or delete them from the list.

Figure 3‑4: List all datasets of a sensor
In the adding page (Figure 3-5), users need to select dataset name, enter its frequency, and select the activity, which was recorded. The raw data in CSV format can be uploaded to the system using the upload field.

Figure 3‑5: Add a dataset
In the listing page, users can delete a dataset by clicking on the “Delete” button at the end of each row. Figure 3-6 presents the confirmation step where the system asks users if they are sure before removing the dataset from the sensor.

Figure 3‑6: Delete a dataset
Data Visualization
This section introduces the visualization features and functionalities of the STOP portal. Fitness and sensory data are collected and visualized for the users to have better overview and understanding of their activities, food and water consumptions, and exercises. There are 3 categories where data is visualized. They are fitness tracking for current date, fitness history, and sensory dataset.
Fitness Overview
The Fitness Overview provides a quick look at users’ fitness current progress compare to their target each day. This feature can be accessed from the Fitness > Overview menu. In figure 4-1, users’ current status in water consumption, food consumption, exercises, and steps, are visualized. Meanwhile, the target is either calculated by the system based on user’s fitness profile or imported from an external service, such as Fitbit. Users will need to overcome this target in order to reach their fitness goal.

Figure 4‑1: Fitness overview minimized
Each category in the Fitness Overview can be expanded or hidden. The “Today” tab shown in Figure 4-2 provides a quick overview of water consumption, food consumption, exercise, or activity by listing all records belong to these categories created in the current day. The Add buttons provide quick access for the users to add more record. Users can quickly import new data from their wearable device by clicking on the “Sync Now” button without going to the Synchronize menu.

Figure 4‑2: Fitness overview maximized
Fitness History
Unlike the “Today” tab, where all data in a day is presented, the “History” tab (Figure 4-3) visualize fitness data from a date range. Users can select a start and end date where they want to visualize all the records created inside this period. After clicked on the “View History” button, a chart with 2 axes will be generated for each category, such as steps, exercises, meals, waters. This helps users to have a better view over their activities over time.

Figure 4‑3: Fitness activities over time
Sensory Dataset
Another visualization users can use is viewing the dataset as shown in Figure 4-4. While viewing a dataset, users can read all information related to it, such as ID, frequency, activity. Furthermore, they can preview the data in the CSV format and download the full file. Finally, a chat with 2 axes that visualize that data is presented.

Figure 4‑4: View a dataset
Feasibility Study Preparation
The output of this deliverable is in the mean of a demonstration. Beside the screenshots presented in this document, a demonstration video can be found here:
The video was uploaded to the STOP portal and published using the same knowledge management system presented in this document.
Furthermore, the STOP Data and Knowledge Management, Pre-Processing, and User Interaction that was shown here will be re-used in the feasibility study, which is scheduled in the next few months. The system then can be extended and adapted based on the result of this study.
The procedure as well as result of the feasibility study will be reported in another deliverable.

Deliverable D2.2
STOP Data and Knowledge Management, Pre-Processing, and User Interaction layer first release
|
Work Package |
Data and Knowledge Management, Pre-Processing and User Interaction- Component and Service Refinement and Implementation |
|
Task(s) |
|
|
Author(s) |
Binh Vu, Felix Engel |
|
Document ID |
D2.2_ STOP Data and Knowledge Management, Pre-Processing and User Interaction layer first release_M18 |
|
Approver |
Matthias Hemmje |
|
Creation date |
11/08/2020 |
|
Last update |
21/09/2020 |
|
Version |
2020.09.21_final |
|
Supersedes |
NA |
|
Dissemination Level |
PU |
*All dates in dd/mm/yyyy format
Document Log
|
Date |
Author |
Changes |
Version |
Status |
|
11/08/2020 |
Binh Vu |
ToC |
2020.08.11_V1 |
draft |
|
12/08/2020 |
Binh Vu |
Add section 3, 4, 5 |
2020.08.12_V1 |
draft |
|
18/08/2020 |
Felix Engel |
Revision of section 1, 2, and 3 |
2020.08.13_V1 |
draft |
|
18/08/20 20 |
Binh Vu |
Update section 2, 3, 4 |
2020.08.18_V1 |
draft |
|
21/08/2020 |
Binh Vu |
Refer figures in text |
2020.08.21_V1 |
draft |
|
04/09/2020 |
Binh Vu |
Update section 1 |
2020.09.04_V1 |
draft |
|
17/09/2020 |
Binh Vu |
Update section 5 |
2020.09.17_V1 |
draft |
|
21/09/2020 |
Felix Engel |
Edit section 1 |
2020.09.21_final |
final |
Contents
2 Data and Knowledge Management: Cognitive Walkthrough 7
2.1.3 Fitness Data Importing 12
2.1.7 Water Consumption Manager 28
2.2.4 Content and Knowledge Importing 48
2.2.6 Content and Knowledge Searching 54
3 Sensory Data Fusion: Cognitive Walkthrough 55
5 Feasibility Study Preparation 63
Introduction
The STOP project will address the health societal challenge of obesity with the specific objectives of mitigating the enormous and growing Health Care costs of obesity and related health issues. The project proposed solution is the foundation of an innovative platform to support Persons with Obesity (PwO) with better nutrition under the supervision of Healthcare Professionals. Therefore, the STOP Platform will capture various PwO data from different kind of smart sensor streams and Chatbot technology, manage and enrich available data with existing knowledge bases and fuse these by machine learned driven Data Fusion approaches for sophisticated AI data analysis.
The WP2 has a strong relation with other WPs, especially in refining and implementing of the STOP platform architecture which is for convenience as well depicted in Figure 1-1. To provide a better overview of the integration of this report with the architecture, we will shortly summarize some key points. The architecture contains a Persistant Layer (located in the cloud), which consists of a Structured Content area (Digital Library and Multimedia Archive) for the Content and a Knowledge Network (KN) for KOs (details see D2.1). The KM-EP is based on a flexible integration architecture with service harmonization capabilities (an architecture about KM-EP could be found in D2.1).

Figure 1‑1: STOP Platform Architecture Data & Knowledge Ecosystem
As marked with different colours in the figure, the platform is combined the works of WP2 and WP3. Overall, the project Work Package 2 (WP2), which is described in this deliverable, is focused on topics related to:
- Sensory Data Fusion: Merging raw data with captured data into KOs
- Data & Knowledge Management – KM-EP: Manages the SDF input and output
- Information Visualisation: Visualise the Content and Knowledge
Other parts of the STOP platform, such as e.g. AI Chatbot and Gamification App, are reported in other deliverables. This report is the second deliverable of the work package 2 with scope on the first STOP Platform release that is conceptualised in the deliverable 2.1 (see Figure 1-2).
Figure ‑: Relation of STOP deliverables
The aim of this report is to document the project achievements to the following objectives:
- O2.2: Conduct software implementation and refinement activities of policies and workflows to enable access and use of data and meta data, managed through the STOP Platform, besides establishing security functionalities, Semantic Data Integration and Fusion.
- O2.3: Conduct software implementation and refinement activities, of innovative Visualisation algorithms and techniques to support case pilot specific user interaction with managed data.
To address the scope of this report and above objectives, project work in WP2 is split in in five tasks. The structure of this report will follow the order of tasks (from DoA) that are already worked in during various secondments. The first four tasks are already relevant for this report and copy and pasted for convenience:
- T2.1 Task lead: CIT. Contributors: FTK, Sensory interfaces Implement an initial selection of sensory interfaces for the STOP Platform. These interfaces will provide a generic approach to engage different types of wearable sensors into the STOP Platform. To be further managed and enriched through the Data Management component. (Secondment No. 2, 12, 23)
- T2.2 Task lead: CIT. Contributors: FTK, Data Fusion Research, selection and integration of machine learning algorithms to be used sensory Data Fusion. (Secondment No. 2, 12, 23)
- T2.3 Task lead: FTK. Contributors: CIT, OKK. Data & Knowledge Management: implementation, refinement and documentation Implementation, refinement and documentation of Semantic Data Integration and Fusion functionalities. This will enable broad subsequent processing and data exchange throughout system barriers and comprehensive Knowledge Management with available data. Actually, the semantic Data Fusion could as well be regarded as a semantic information integration process that enables a unified and unique data access interface. Therefore, amongst others a formal extensible ontology will be developed and validated to represent the relevant concepts and relations of the food domain. Address ethical implications that goes along with the platform implementation and refinement of workflow and access functionalities. (Secondment No. 3, 7, 25)
- T2.4 Task lead: OKK. Contributors: CIT, FTK. Visualisation: Implementation, refinement and documentation. An intuitive visualisation dashboard will be designed that is personalised to each user. The visualisation will complete the loop in the quantified-self paradigm by enabling effective feedback for reflection, planning, actionable insights and for self-understanding. The visualisation will be co-designed with users to ensure that it is useful and user-centred. The visualisation will be interactive in nature and will allow the user to interrogate the data on multiple levels of detail where the sophistication and granularity is controlled by the user. Interpretation of the visualisation will be validated using the concurrent think-aloud protocol otherwise known as a cognitive walkthrough with users. Finally, the visualisation will be audited using design principles and heuristics from Gestalt psychology. (Secondment No. 8 & 13).
The report documents four cognitive walk through of the Platform components Data and Knowledge Management, Sensory Data Fusion, and Data Visualisation. Each walkthrough demonstrates stepwise the functionality of the system components with screenshots and their descriptions.
Data and Knowledge Management: Cognitive Walkthrough
In this section, the Data and Knowledge Management developed in the context of the STOP project is presented. The walkthrough is split into a description of the data management functionality for the management of fitness data and a section that reports on the functionality for knowledge management.
Fitness Data Management
Fitness Data Manager supports users in the task of importing, creating, and managing their fitness data. They consist of several modules that helps to manage users’ activities, exercises, food and water consumptions, weights, and goals.
User Registration
Go to the STOP portal at https://stop.projekt.onl/. Users are required to login using their username and password. Unregistered users click on “Register” button to go to the registration page (see Figure 2‑1).
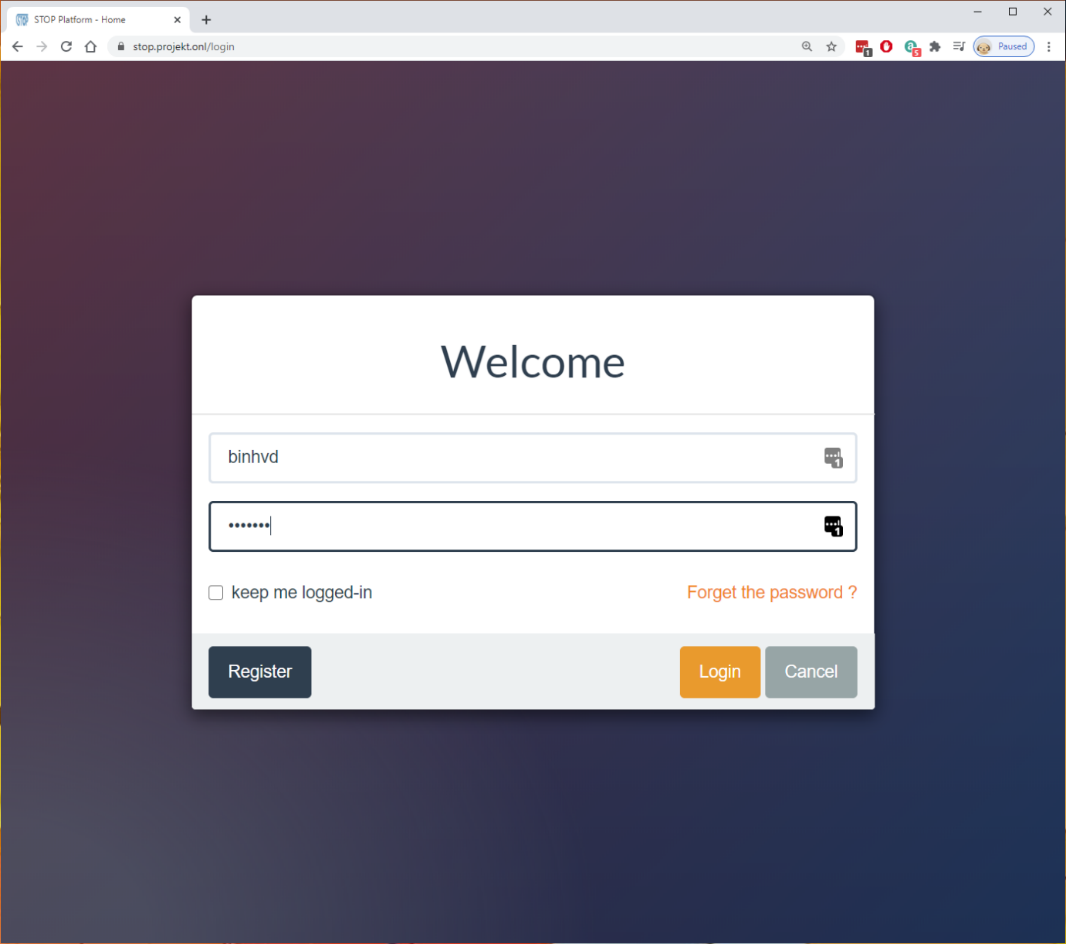
Figure ‑: User registration UI
Users will need to fill in their personal information and choose a username and password to complete the registration process. All optional and required fields are presented in Figure 2‑2.

Figure ‑: User registration form
Fitness Overview
After completed registration and login using username and password, users are required to create a fitness profile. This step is needed for the system to calculate a personalized fitness plan for each user (Figure 2‑3).

Figure ‑: Create a fitness profile
The fitness profile also requires user’s current weight. The current weight could be added through the form shown in Figure 2‑4.
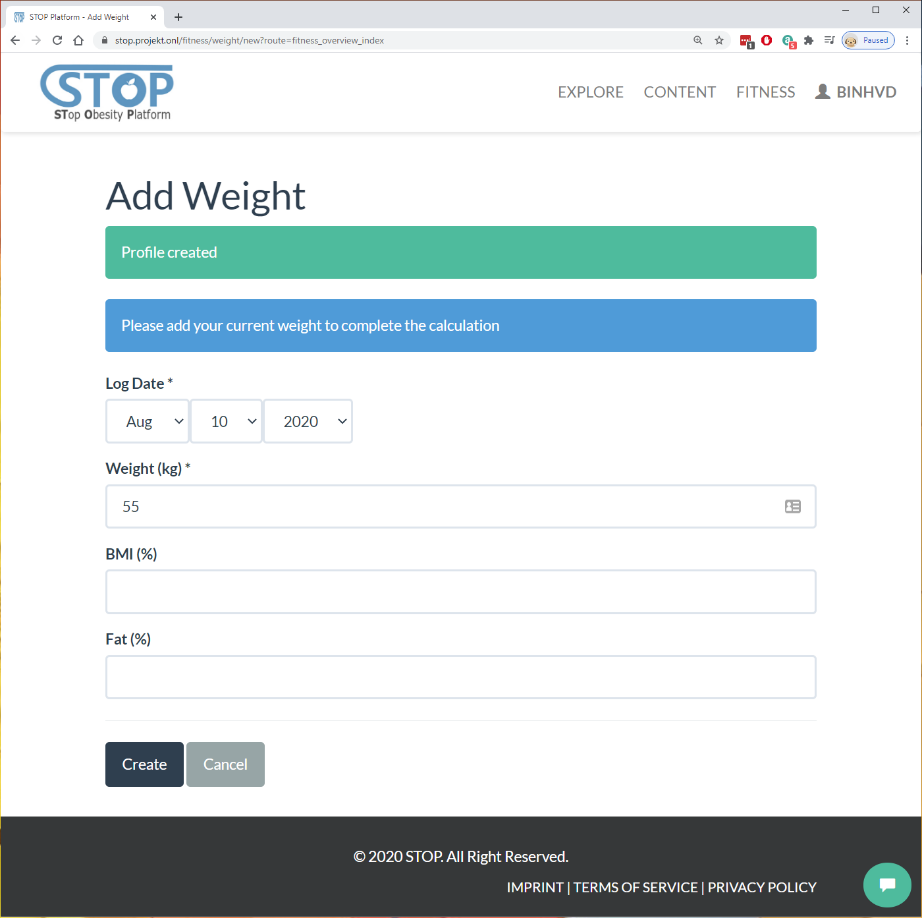
After the fitness profile was created, user can edit it by going to menu Fitness > Overview on the navigation bar. Figure 2-5 shows the editing form.

Figure 2‑5: Edit fitness profile
Fitness Data Importing
Users have the possibility to import their fitness data from a wearable device. By going to menu Fitness > Synchronize > Fitbit, users can access and import data from any Fitbit device (Figure 2-6).

Figure 2‑6: Import from Fitbit
Users will need to authorize the STOP portal to access their fitness data by logging in using their Fitbit account. Figure 2-7 presents Fitbit’s login interface.

Figure 2‑7: Login Fitbit account
After authorized the STOP portal, users will be redirected back to the portal. Here, they can choose to access to new data created since the last import. If users haven’t import data from this service before, the system will suggest to load all data created from the last 3 months.
Users have the option to change the import date then click on the “Load New Records” button to download their fitness data (Figure 2-8).

Figure 2‑8: Load data from Fitbit
After loading fitness data from Fitbit, users can preview them. There are 6 types of fitness data loaded: Activities, Exercises, Weights, Foods, Waters, and Goals. As shown in Figure 2-9, users can click on the “Activities” tabs to browse the activity records. They can also search for specific record by using the search box.

Figure 2‑9: List loaded activities
Similar to activity, users can browse exercise records in the “Exercises” tab. The related data for each exercise is shown in Figure 2-10.
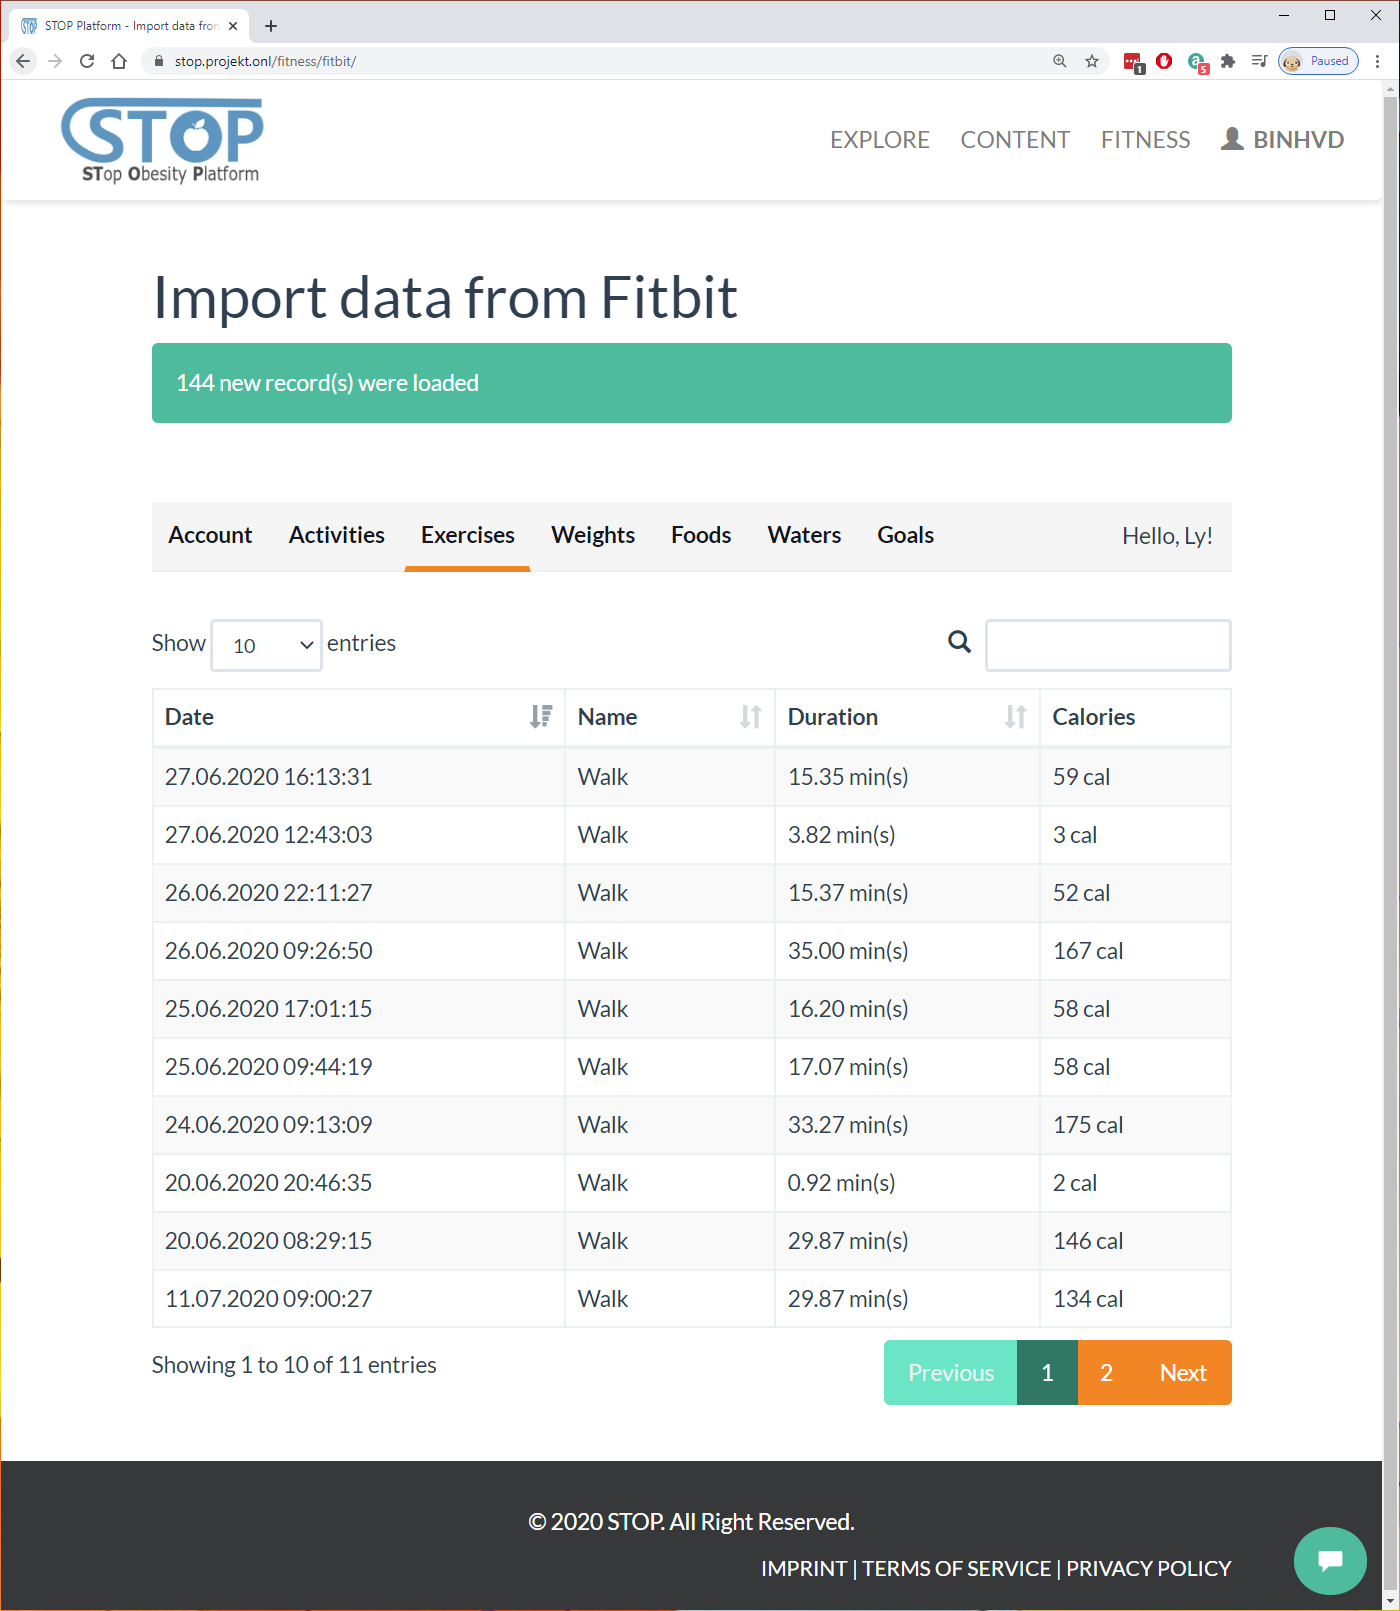
Figure 2‑10: List loaded exercises
Users can look at their weight-related data each day in the “Weights” tab as shown in Figure 2-11.
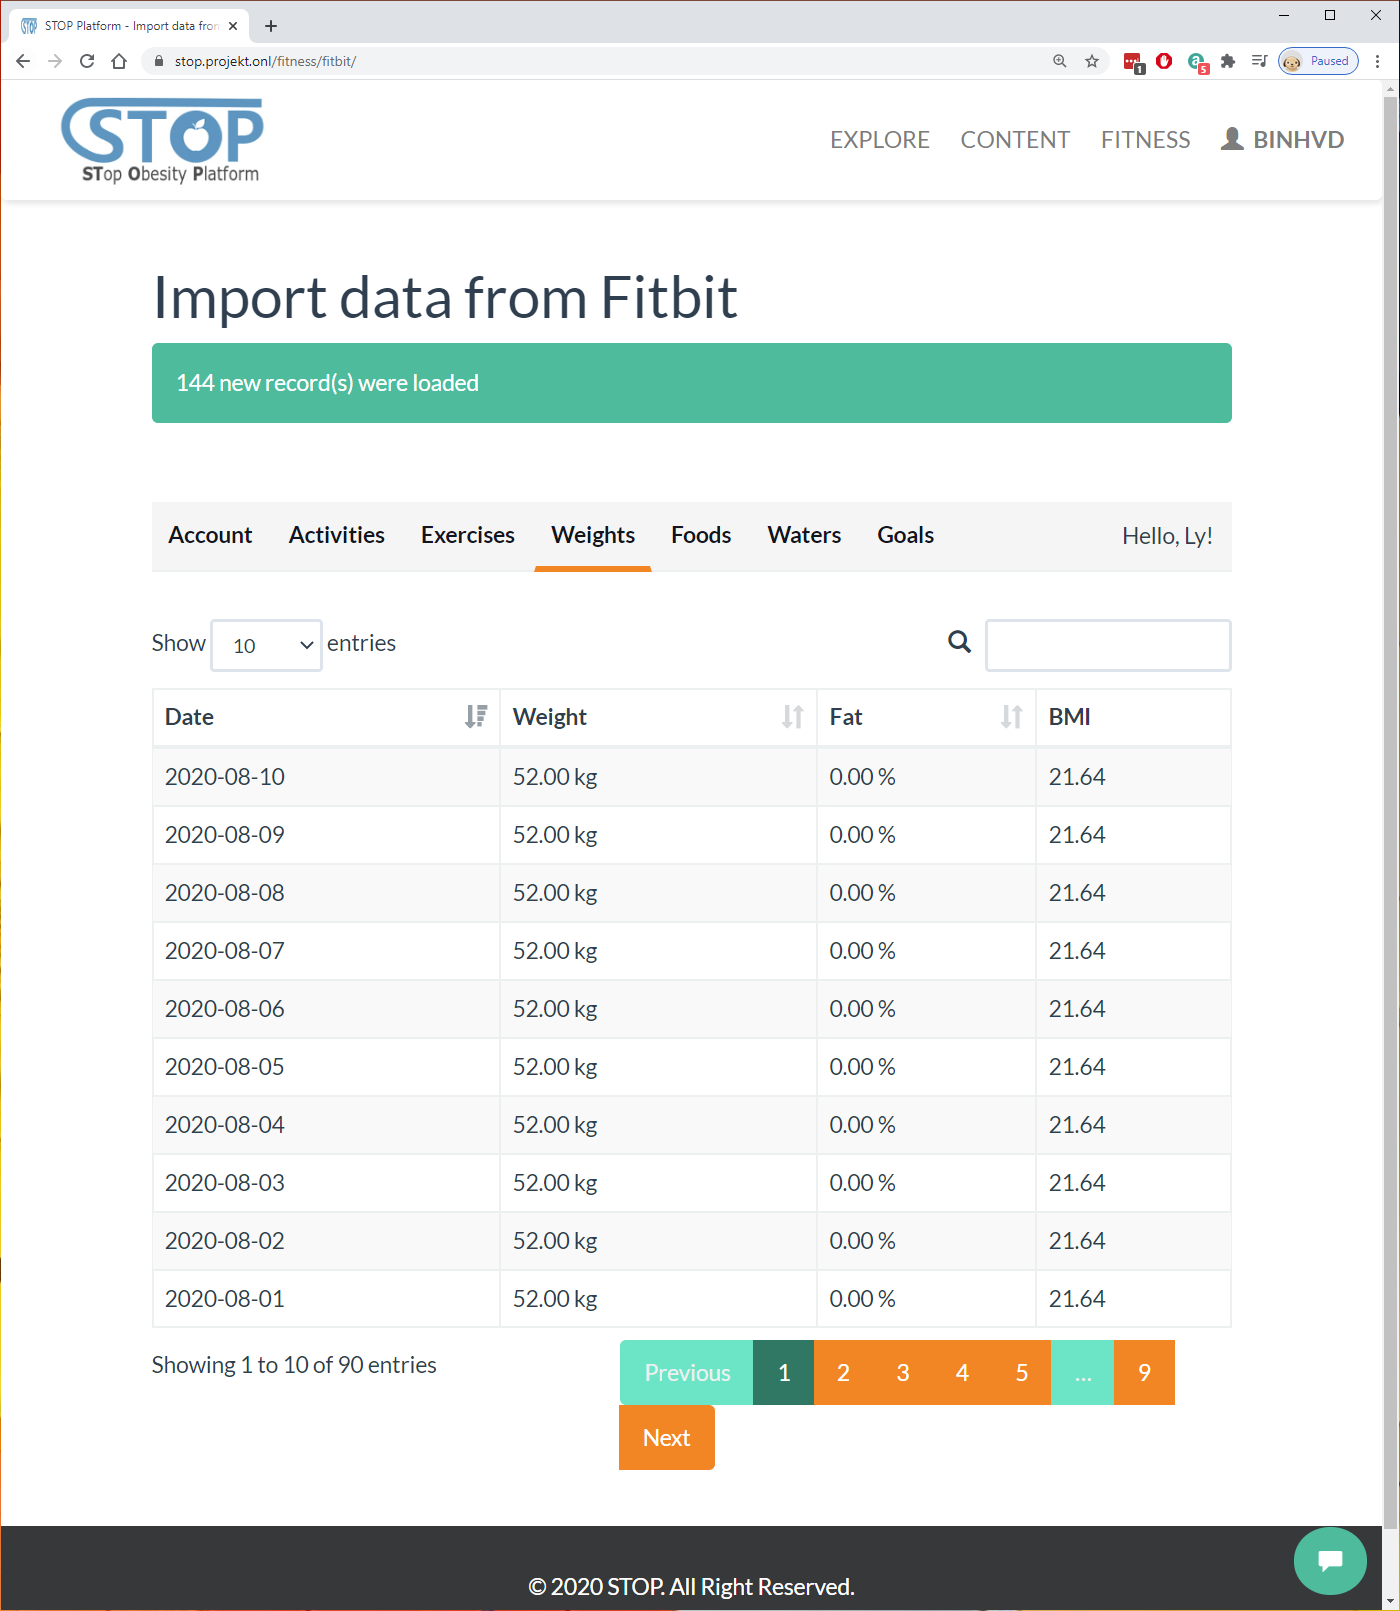
Figure 2‑11: List loaded weights
If users enter their food consumption, such as food name, consumption time… to their Fitbit account, it will be listed in the “Foods” tab (Figure 2-12).
The same applies to water. It will show how much water user drank each day.
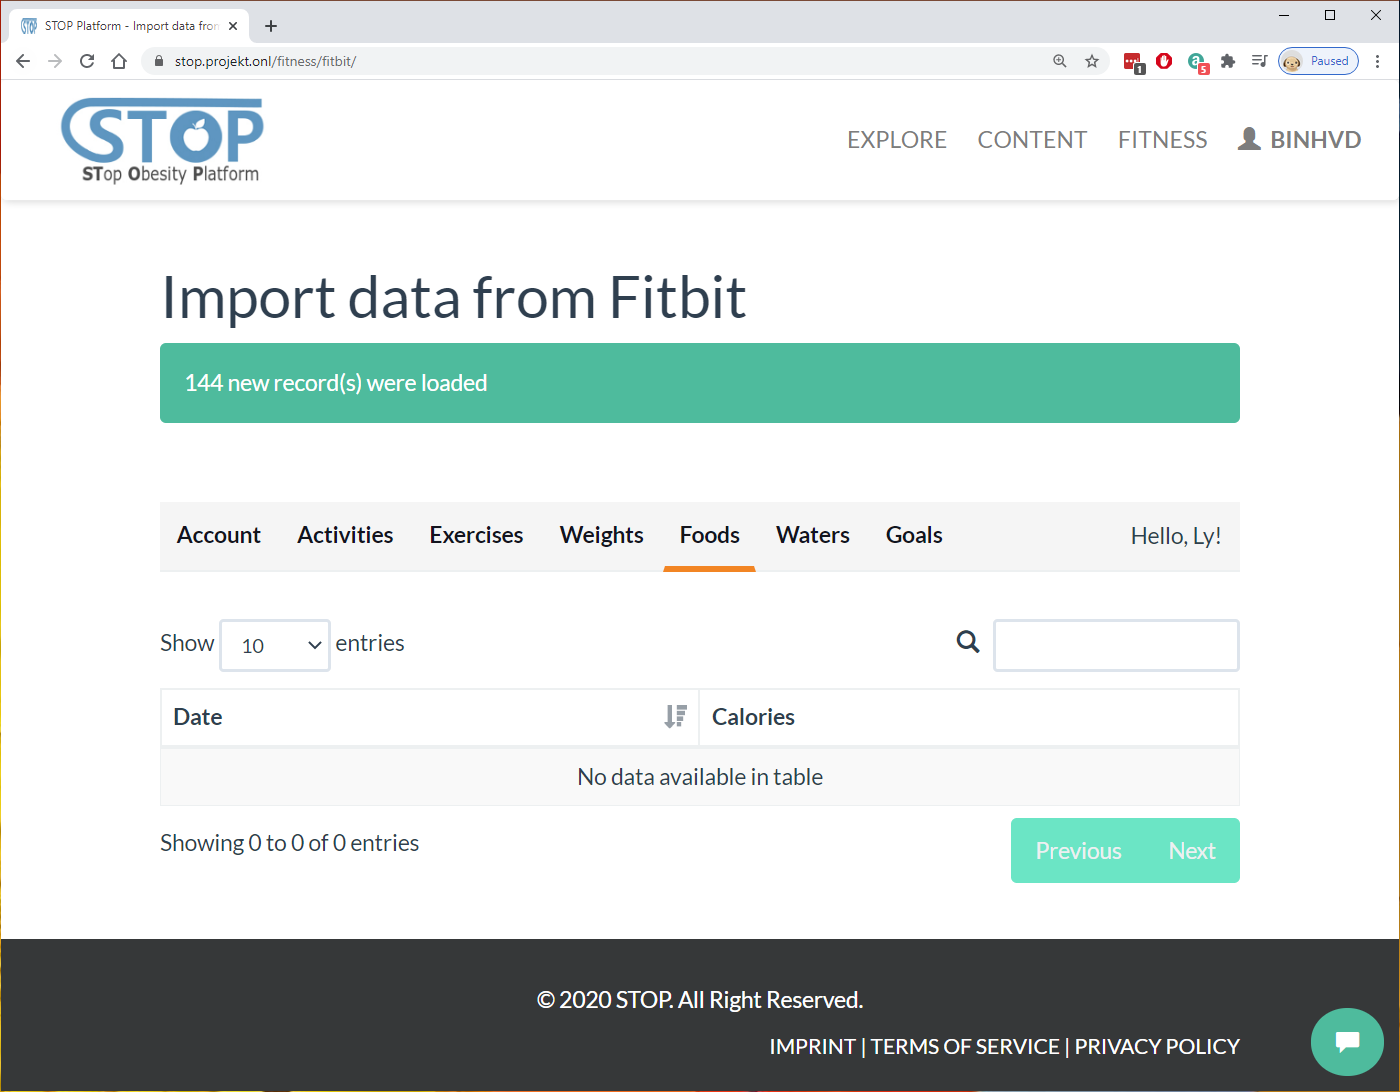
Figure 2‑12: List loaded foods
Finally, the last tab shows the target users added or calculated by Fitbit based on the users’ fitness profile (Figure 2-13).

Figure 2‑13: List loaded goals
After viewing all their data, users click on “Synchronize” button at the end to import them to the STOP portal. The system will show how many records were imported successfully as in Figure 2-14.

Figure 2‑14: Import data successfully
Activity Manager
After fitness data was imported, users can manage their data in the “Fitness” menu. To manage activity data, users can go to Fitness > Activities menu. In Figure 2-15, all activity records are listed. Users can either edit existing records by clicking on “Edit” button or create a new activity by clicking on “Add Activity”.
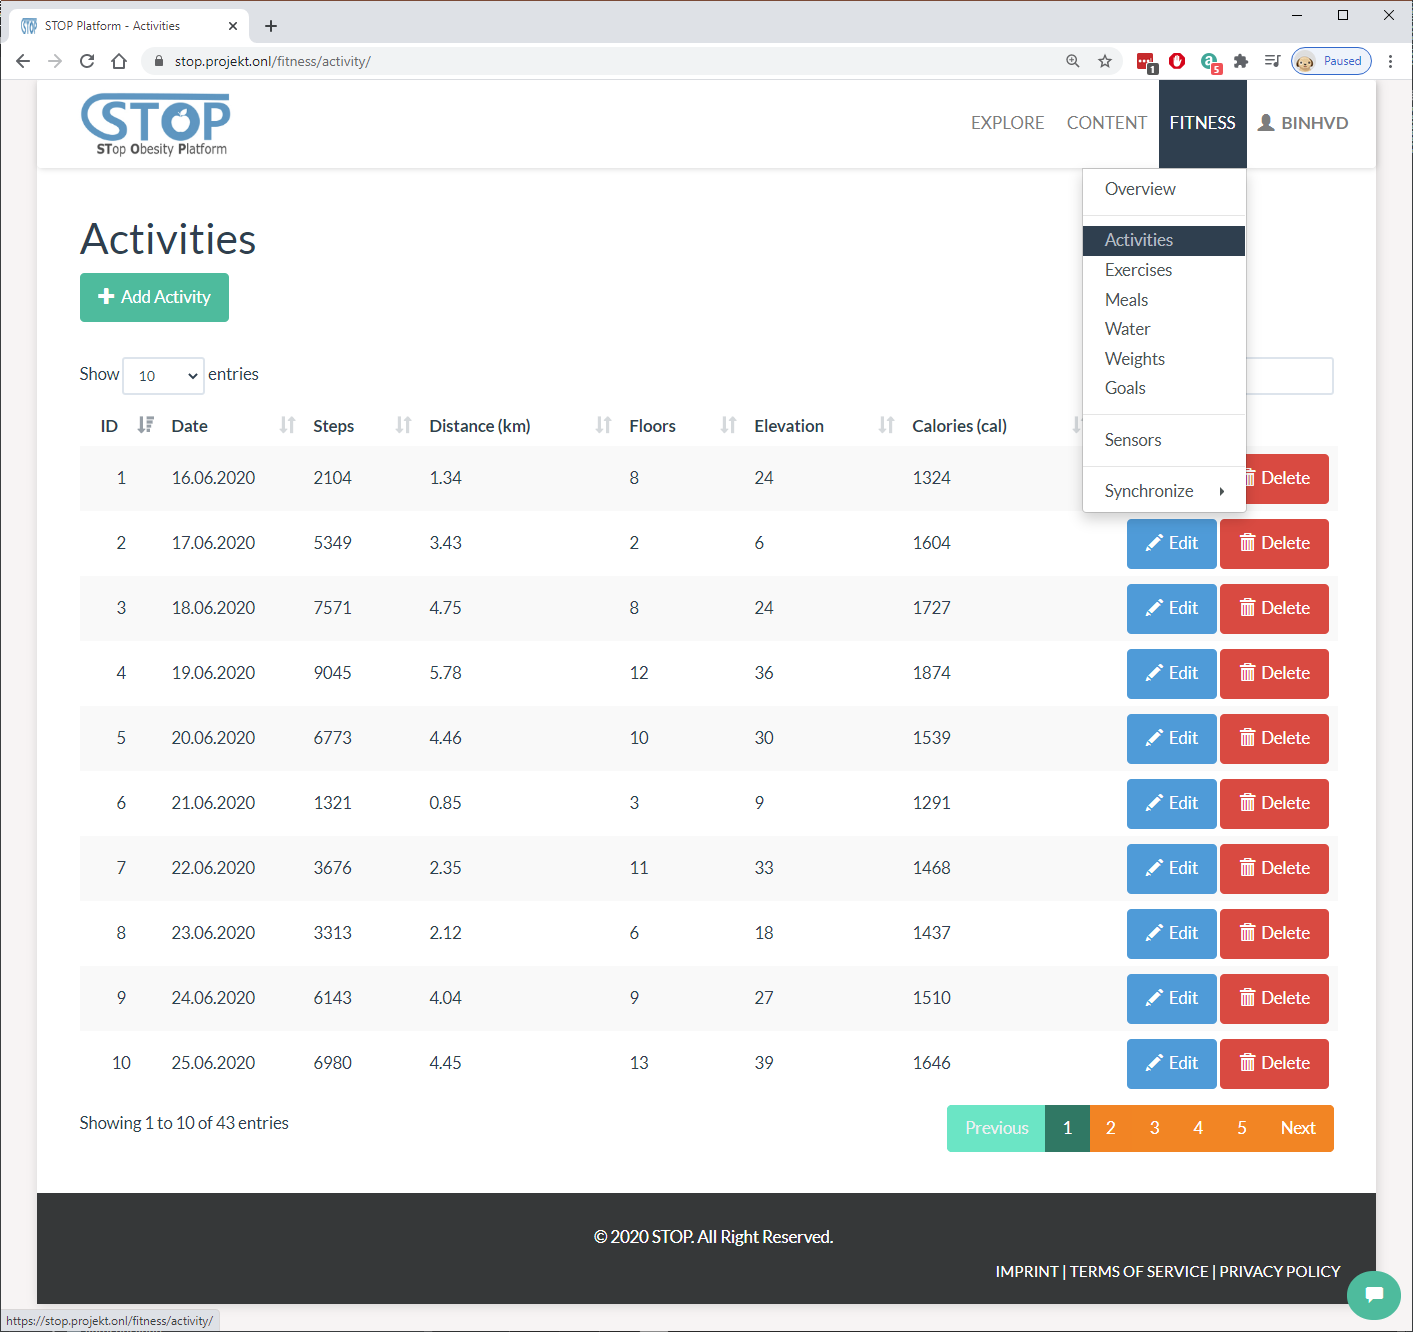
Figure 2‑15: List created activities
In the “Add/Edit Activity” page as shown in Figure 2-16, users need to fill out the required fields, such as “Log Date”. Other fields, such as “Log Time”, “Distance”, “Steps”, are optional. After filling out all the information, users click on “Create/Save” to create a new activity or save the edited record. Furthermore, users can also click on “Cancel” button to come back to the listing page.

Figure 2‑16: Edit an activity
On the listing page, users click on the “Delete” button of a record to remove this record from the database. The system will ask for users’ confirmation to make sure that they have not clicked on this button by mistake (Figure 2-17).

Figure 2‑17: Delete an activity
Exercise Manager
Next to “Activities” menu is the “Exercises” menu, where users can manage their exercise records (Figure 2-18). Similar to “Activities”, users can click on “Edit” button to edit existing record or “Add Exercise” button to create a new exercise.

Figure 2‑18: List created exercises
In the “Add/Edit Exercise” page shown in Figure 2-19, users will need to fill out the information related to their exercise, such as name, date, description, distance, etc. After completed this step, users click on the “Create/Save” button to save the input to the database. Users can stop this process and go back to the listing page anytime by clicking on the “Cancel” button.

Figure 2‑19: Edit an exercise
On the listing page, users can delete a record by clicking on the “Delete” button at the end of the row. Figure 2-20 shows the system asking users once more time before removing the record from the database.

Figure 2‑20: Delete an exercise
Meal Manager
Users can manage their food consumption by selecting Fitness > Meals menu (Figure 2-21). Here they can ask the system to suggest a recipe for their next meal or add a meal that they just ate. Furthermore, users can edit the created record in the list.

Figure 2‑21: List created meals
In the “Add/Edit Meal” page in Figure 2-22, users will need to add the food they ate in the meal then click on the “Create/Save” button to save the input to the database. Otherwise, users can stop this process and go back to the listing page anytime by clicking on the “Cancel” button.
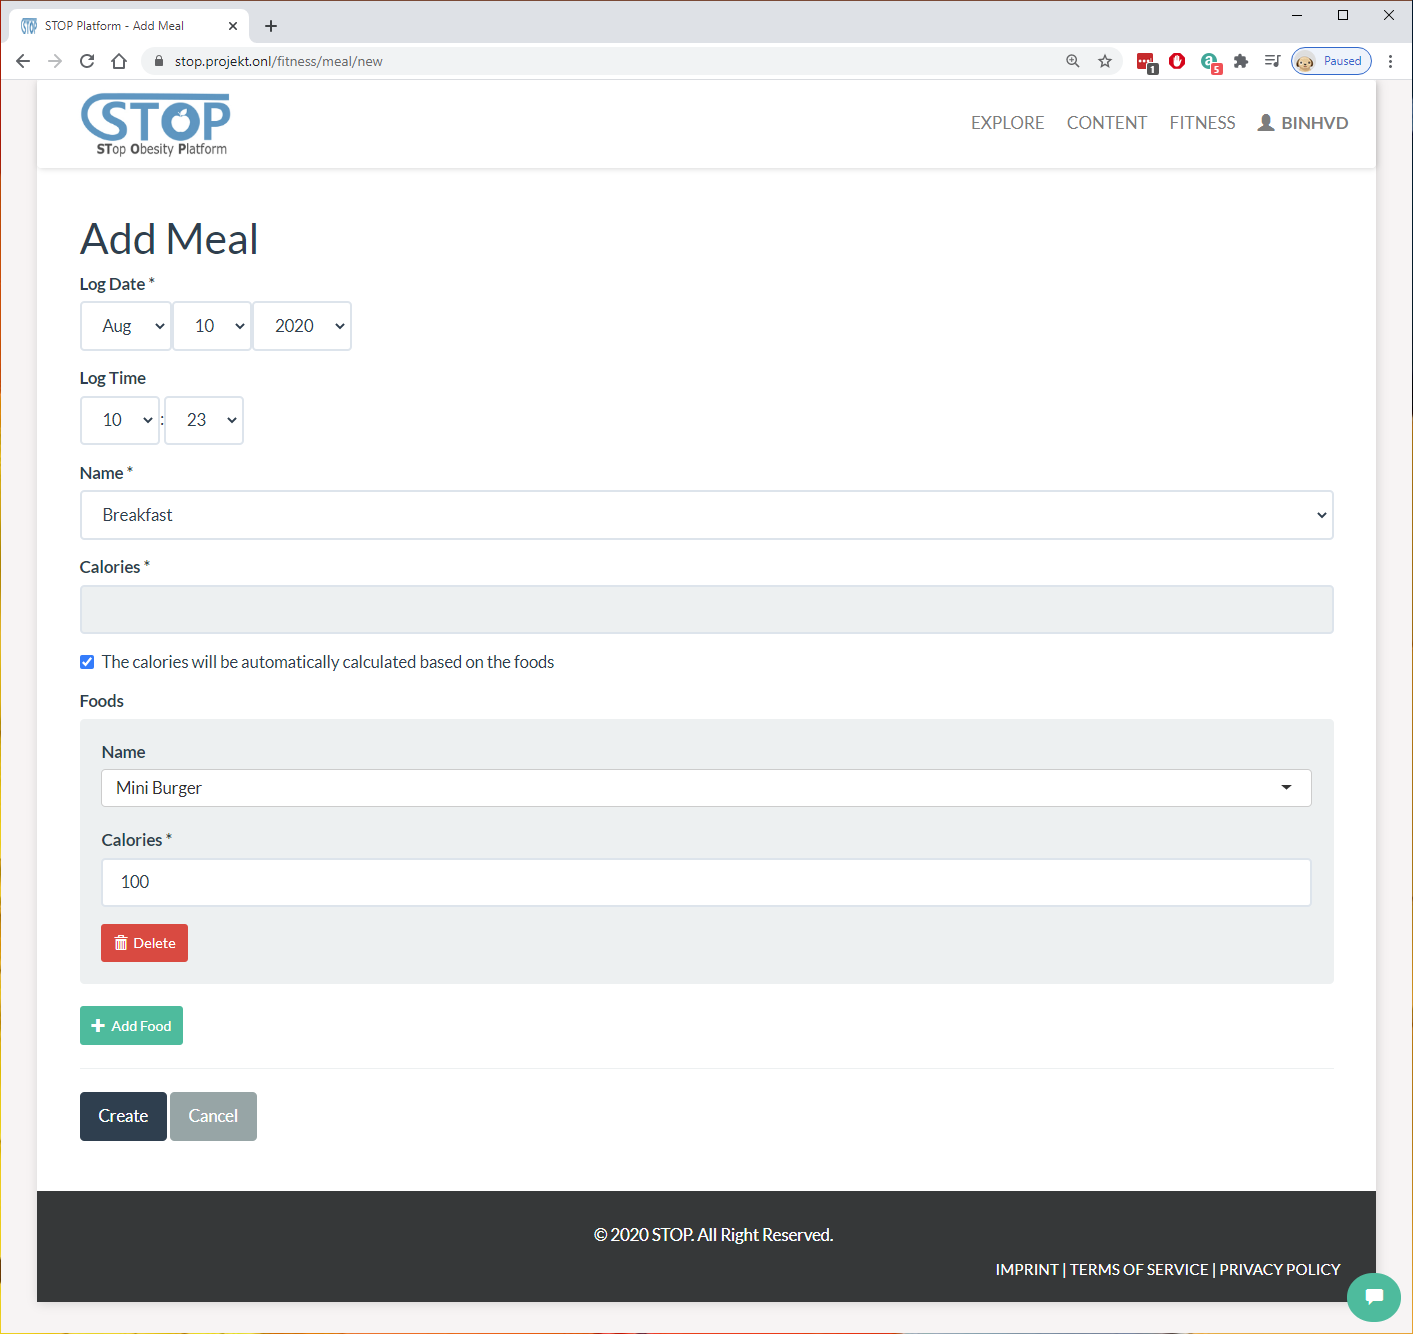
Figure 2‑22: Add a meal
Similar to other type of data, users can delete a meal record by clicking on the “Delete” button at the end of the row. The system will need users’ confirmation once more time before removing the record from the database as shown in Figure 2-23.

Figure 2‑23: Delete a meal
Water Consumption Manager
Users can manage their water consumption by selecting Fitness > Water menu. Here they can add a drink record to the system or edit the added drink in the list shown in Figure 2-24.

Figure 2‑24: List created water consumptions
In the “Add/Drink Water” page as shown in Figure 2-25, users fill out the timestamp and volume of the drink then click on the “Create/Save” button to save it to the database. Otherwise, users can stop this process and go back to the listing page anytime by clicking on the “Cancel” button.

Figure 2‑25: Drink water
In the listing page, users can delete a drink by clicking on the “Delete” button at the end of the row. The system will ask users if they are sure before removing the drink from the database (Figure 2-26).

Figure 2‑26: Delete a water consumption
Weight Manager
In the Fitness > Weights menu, users can manage the changes of their weight over time. Here they can add, edit, or delete their weight records. Figure 2-27 shows the list of user’s weight records.

Figure 2‑27: List created weight records
In the “Add/Edit Weight” page in Figure 2-28, users type in their weight along with BMI and Fat value then click on the “Create/Save” button to save them to the database. Users can also click on the “Cancel” button to stop this process and go back to the listing page.

Figure 2‑28: Add a weight record
In the listing page presented in Figure 2-29, users can delete a record by clicking on the “Delete” button at the end of each row. The system will ask users if they are sure before removing the record from the database.

Figure 2‑29: Delete a weight record
Goal Manager
Finally, users can manage their fitness goals by going to the Fitness > Goals menu. Here, goals imported from fitness services and created by the users in the portal are listed. Users can create, edit, or delete them from the database as illustrated in Figure 2-30.

Figure 2‑30: List created goals
In the listing page, users can delete a goal by clicking on the “Delete” button at the end of each row. Figure 2-31 shows the system asking users if they are sure before removing the goal from the database.

Figure 2‑31: Delete a goal entry
After clicking on “Edit” or “Add Goal” button, users will be directed to the “Add/Edit Goal” page. Here, users fill out the needed information then click on the “Create/Save” button to save them to the database. Furthermore, users can click on the “Cancel” button to go back to the listing page as shown in Figure 2-32.

Figure 2‑32: Edit a goal entry
After new goals were created, users can select between them and “Auto Calculation” in the Fitness Profile anytime (Figure 2-33). This will change the user’s target for each day in the Fitness Overview visualization.

Figure 2‑33: Change goal profile
Knowledge Management
This system manages all content and knowledge in the STOP portal. New content and knowledge can either be created by the users or imported from external files and services.
Publication Manager
Users can manage publications in the Content > Publication menu. Here, they can create, edit, and delete publication records in the database. Users can also view a publication by clicking on its title. Figure 2-34 shown the management page.

Figure 2‑34: List created publications
In the Adding/Editing page in Figure 2-35, users need to fill out the metadata for the publication. The metadata is split into several groups, such as authors, identifiers, publishers, etc. In “Multimedia” group, users are able to upload and manage PDF files for the publication.

Figure 2‑35: Edit a publication
In the listing page, users can delete a publication by clicking on the “Delete” button at the end of each row. The system will ask users if they are sure before removing the publication from the database (Figure 2-26).

Figure 2‑36: Delete a publication
In figure 2-37, the “Content Display” page shows the metadata and download a publication. Here, users can view related information such as title, authors, description, etc. Furthermore, they can rate the quality of the publication as well as share it on the social networks.

Figure 2‑37: View a publication
Multimedia Manager
Users can manage multimedia in the STOP portal by selecting the Content > Multimedia menu. Figure 2-38 illustrates the record list. Here, they can create, edit, and delete multimedia records in the portal. Users can also view a multimedia’s metadata and download it by clicking on its title in the listing table.

Figure 2‑38: List created multimedia
After clicking on the “New Multimedia” or “Edit” button, users are directed into the “New/Edit Multimedia” page as shown in Figure 2-39. Similar to Publication, users need to fill out multimedia metadata and upload data here. There are different types of multimedia, such as video, presentation, audio, zip. Depend on the multimedia type, users will be able to upload different data.

Figure 2‑39: Edit a multimedia
In the listing page, users can delete a publication by clicking on the “Delete” button at the end of each row. Figure 2-40 shows the system asking users if they are sure before removing the publication from the database.
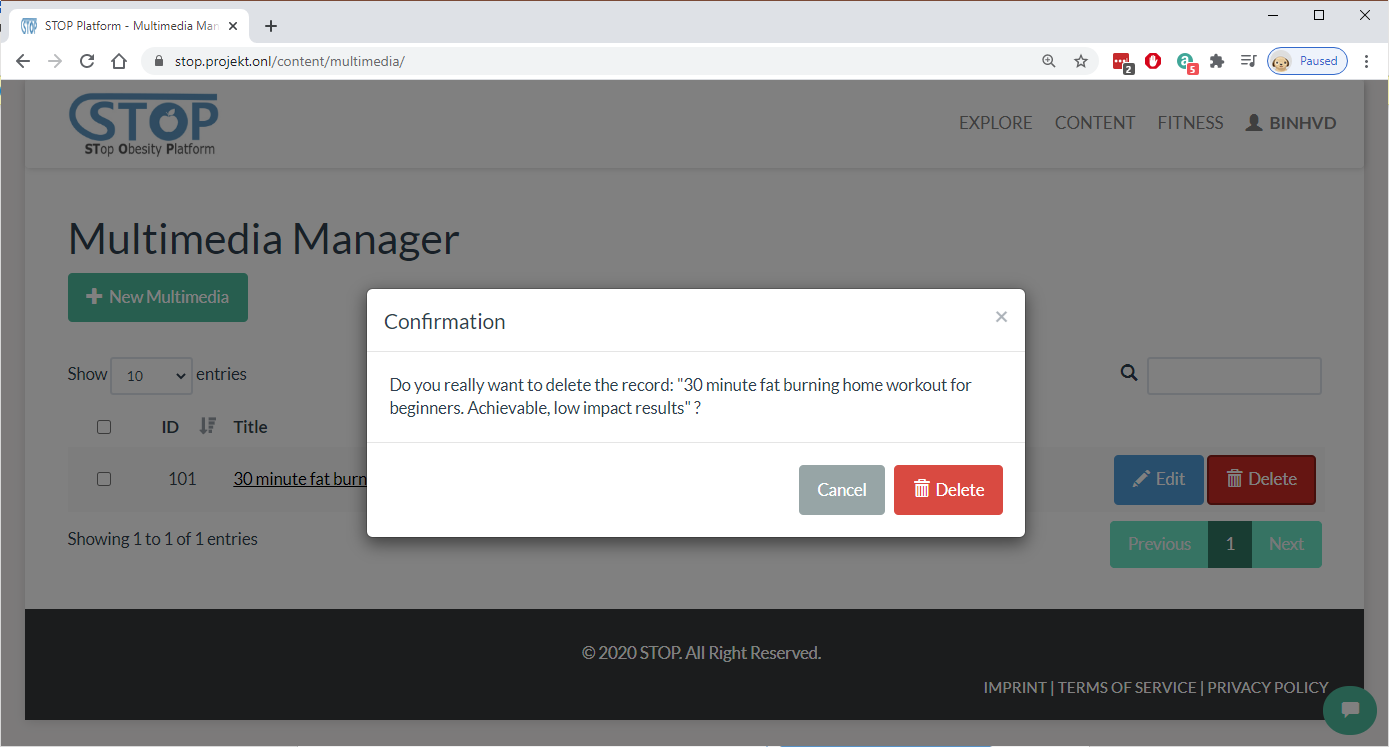
Figure 2‑40: Delete a multimedia
Users are able to look at a multimedia metadata and download or play it content in the “Content Display” page as presented in Figure 2-41. Here, users can read important information such as multimedia title, description, authors, etc. Furthermore, they can also rate this content and share it on different social networks.
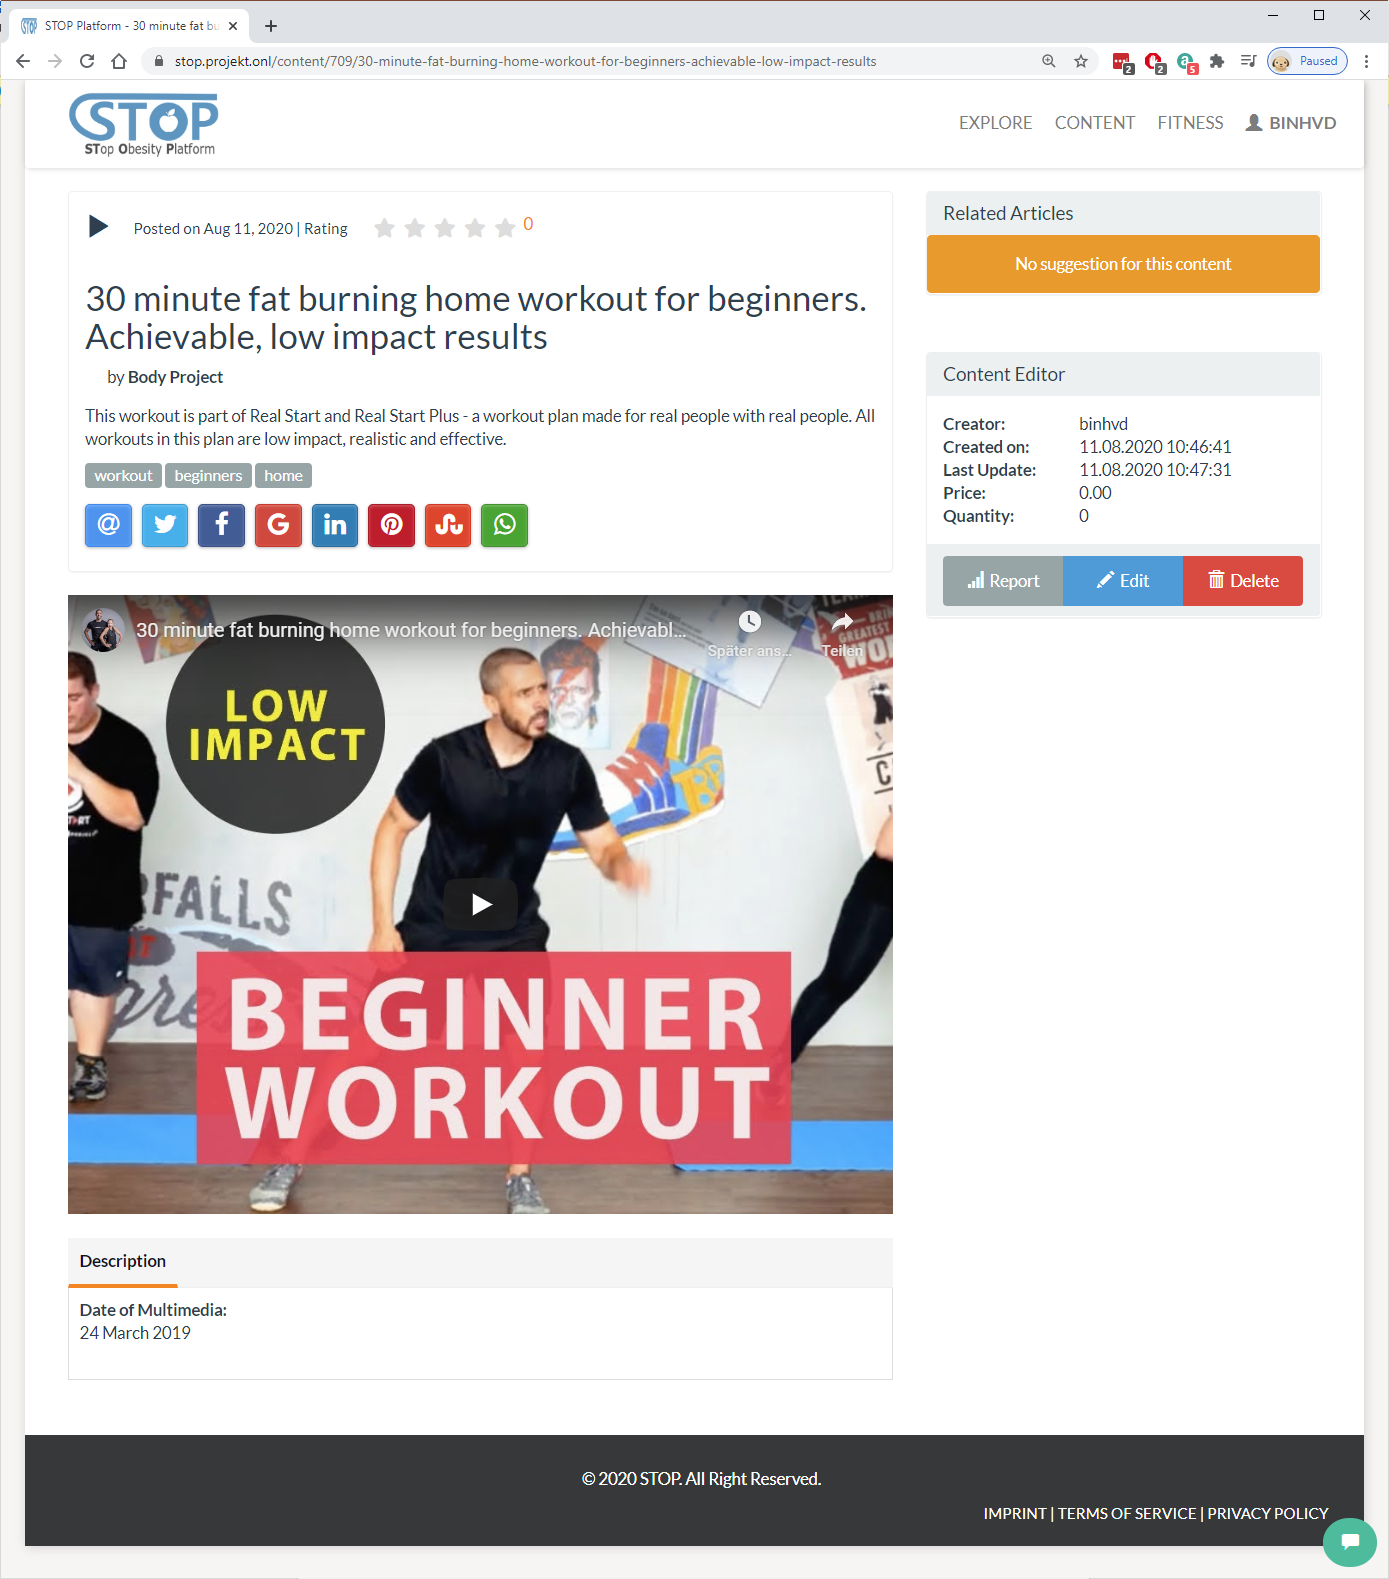
Figure 2‑41: View a multimedia
Taxonomy Manager
Taxonomy is an important type of content that allows users to use it to classify content in the STOP portal. To manage taxonomies, users need to go to the Content > Taxonomy menu. In figure 2-42, taxonomies created by the users are listed for viewing, editing, and deleting. Furthermore, users can create new taxonomy by clicking on the “New Taxonomy” button.

Figure 2‑42: List created taxonomies
In the “New/Edit Taxonomy” page, users are able to create a new taxonomy or edit an exiting taxonomy (Figure 2-43). Users will need to fill out the related information such as taxonomy title, keywords, description, and authors. In the “Structure” tab, users are provided with a taxonomy building tool that supports user in the construction and management of a taxonomy.

Figure 2‑43: Edit a taxonomy
In the listing page, users can delete a publication by clicking on the “Delete” button at the end of each row. The system will ask users if they are sure before removing the publication from the database. Figure 2-44 presents the deleting page.

Figure 2‑44: Delete a taxonomy
Figure 2-45 presents the “Taxonomy Display” page, where users can view the metadata of a taxonomy, its structure, and are able to export it into different formats. Similar to publication and multimedia, users can see the current rating of the viewing taxonomy and rate it by selecting the stars in the top of the page. They are also able share the content on social networks. In the right panel, the system will suggest content that is similar to the viewing taxonomy.

Figure 2‑45: View a taxonomy
Content and Knowledge Importing
Content can be imported from different formats, such as BibTex and OAI-PMH, and external services, such as Mendeley, SlideShare, GibHub, StackExchange, DSpace, and Youtube, to the STOP portal. To do so, users need to go to the Content > Ingest menu. Here, they can select one of the services to start the import process (Figure 2-46).

Figure 2‑46: Import a question from StackExchange
After choosing the content that needs to be imported, the system will direct users to the Import Wrapper Manager (Figure 2-47). It is where the mapping table, which tells the import system which fields from the external service can be copied to which fields in the STOP database, is managed. Here, users can change, delete, import, and export the mapping setting. After making sure the mapping is correct, users click on the “Import” button to start the importing process.

Figure 2‑47: Edit StackExchange’s wrapper
Dialog Manager
Dialog (questions and answers) can be imported from the StackExchange service. After that, they can be managed in the Content > Dialog menu. Here, users can create new dialog, edit existing records, or delete them as presented in Figure 2-48. Users can also read a dialog by clicking on its title or search for dialogs using the searching box.

Figure 2‑48: List created dialogs
Figure 2-49 shows the “New/Edit Dialog”, where users can create/edit a question by entering its title, keywords, and content. The system allows some forms of simple HTML, such as p, li, strong, etc. Users click on the “Save” button to complete the creating/editing or the “Cancel” button to stop the process and go back to the listing page.

Figure 2‑49: Edit a dialog
In the listing page, users can delete a dialog by clicking on the “Delete” button at the end of each row. Figure 2-50 illustrates the final step where the system asking users if they are sure before removing the dialog from the list.

Figure 2‑50: Delete a dialog
In Figure 2-51, users can look at the questions and answers of a dialog. They can also see the upvotes for each answer and the question itself. Furthermore, users have the option to upvote or downvote an answer and the question. The timestamp and author of each answer and question are also displayed for the viewer. Finally, users can provide their answers for the posted question.

Figure 2‑51: View a dialog
Content and Knowledge Searching
Content in the STOP portal is categorized and can be searched by the users. The searching page can be reached by clicking on the “Explore” menu. As present in Figure 2-52, users can enter the searching term then clicking on the “Search” button to start the searching process. After the search result is presented to the users, they can apply filters, such as publication year, type of content, or categorization, for a narrower search result.

Figure 2‑52: Search for content
Sensory Data Fusion: Cognitive Walkthrough
In this section, the sensory Data Fusion developed in the STOP project is introduced. The system’s first release is presented in a cognitive walkthrough where its features and functionalities are described in a series of screenshots and descriptions.
Sensor Manager
Users can manage their sensors by going to the Fitness > Sensors menu. Here the list of all sensors is shown to the viewer (Figure 3-1). Simple information such as the ID of the sensors, their positions, and the number of datasets for each sensor are displayed. Users have the option to add new sensors, view their datasets, or delete sensors from the list.
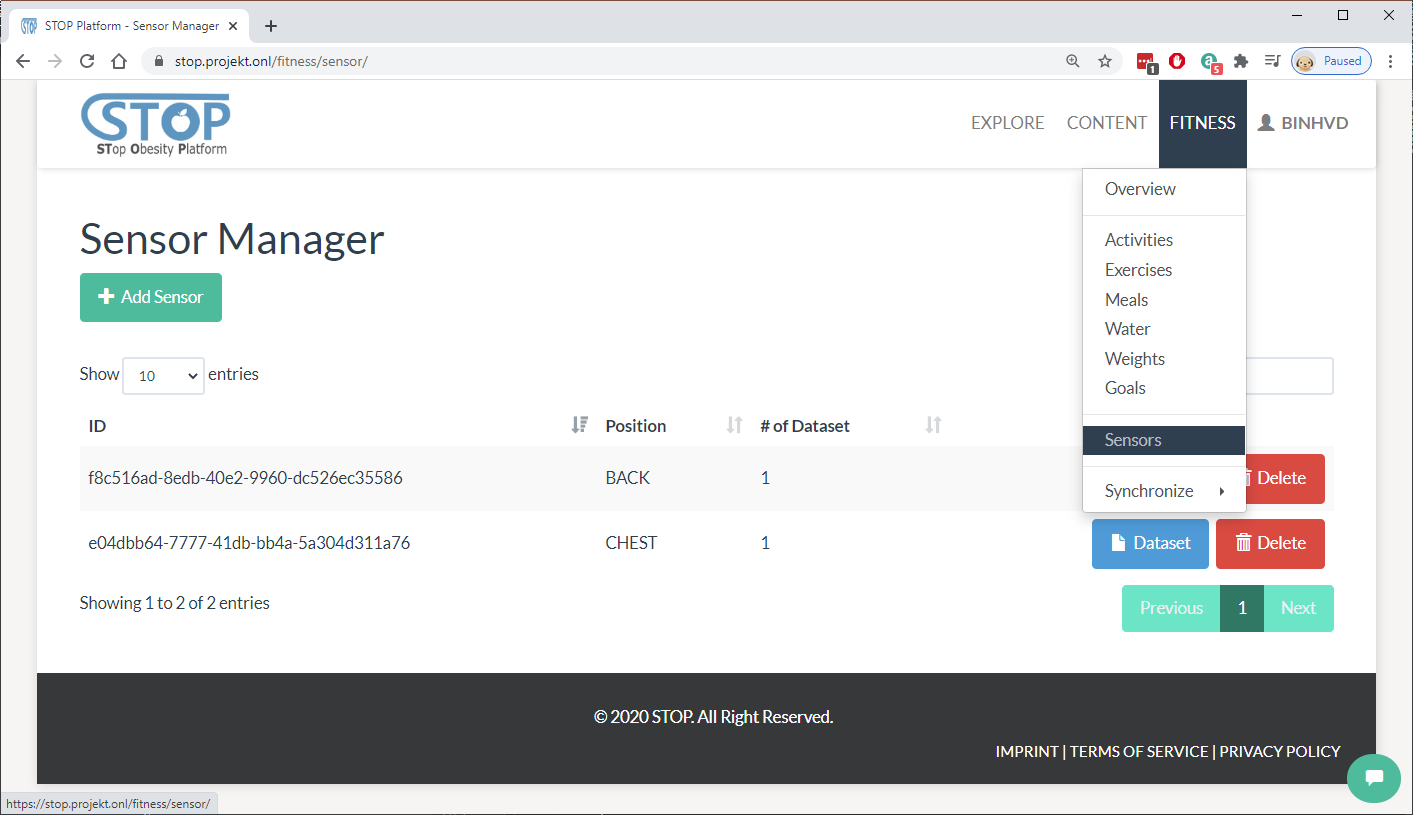
Figure 3‑1: List created sensors
In the adding page, users need to choose the position of the new sensor then click on the “Create” button. They can also click on the “Cancel” button to cancel the process and go back to the listing page as shown in Figure 3-2.

Figure 3‑2: Add a new sensor
In the listing page, users can delete a sensor by clicking on the “Delete” button at the end of each row. The system will ask users if they are sure before removing the sensor from the list (Figure 3-3).

Figure 3‑3: Delete a sensor
Dataset Manager
In the dataset listing page presented in Figure 3-4, users can browse and search for datasets of a chosen sensor. The list shows all datasets belong to a sensor including their IDs, created dates, frequencies, and activities. Users have the option to add new datasets, view them, or delete them from the list.

Figure 3‑4: List all datasets of a sensor
In the adding page (Figure 3-5), users need to select dataset name, enter its frequency, and select the activity, which was recorded. The raw data in CSV format can be uploaded to the system using the upload field.

Figure 3‑5: Add a dataset
In the listing page, users can delete a dataset by clicking on the “Delete” button at the end of each row. Figure 3-6 presents the confirmation step where the system asks users if they are sure before removing the dataset from the sensor.

Figure 3‑6: Delete a dataset
Data Visualization
This section introduces the visualization features and functionalities of the STOP portal. Fitness and sensory data are collected and visualized for the users to have better overview and understanding of their activities, food and water consumptions, and exercises. There are 3 categories where data is visualized. They are fitness tracking for current date, fitness history, and sensory dataset.
Fitness Overview
The Fitness Overview provides a quick look at users’ fitness current progress compare to their target each day. This feature can be accessed from the Fitness > Overview menu. In figure 4-1, users’ current status in water consumption, food consumption, exercises, and steps, are visualized. Meanwhile, the target is either calculated by the system based on user’s fitness profile or imported from an external service, such as Fitbit. Users will need to overcome this target in order to reach their fitness goal.
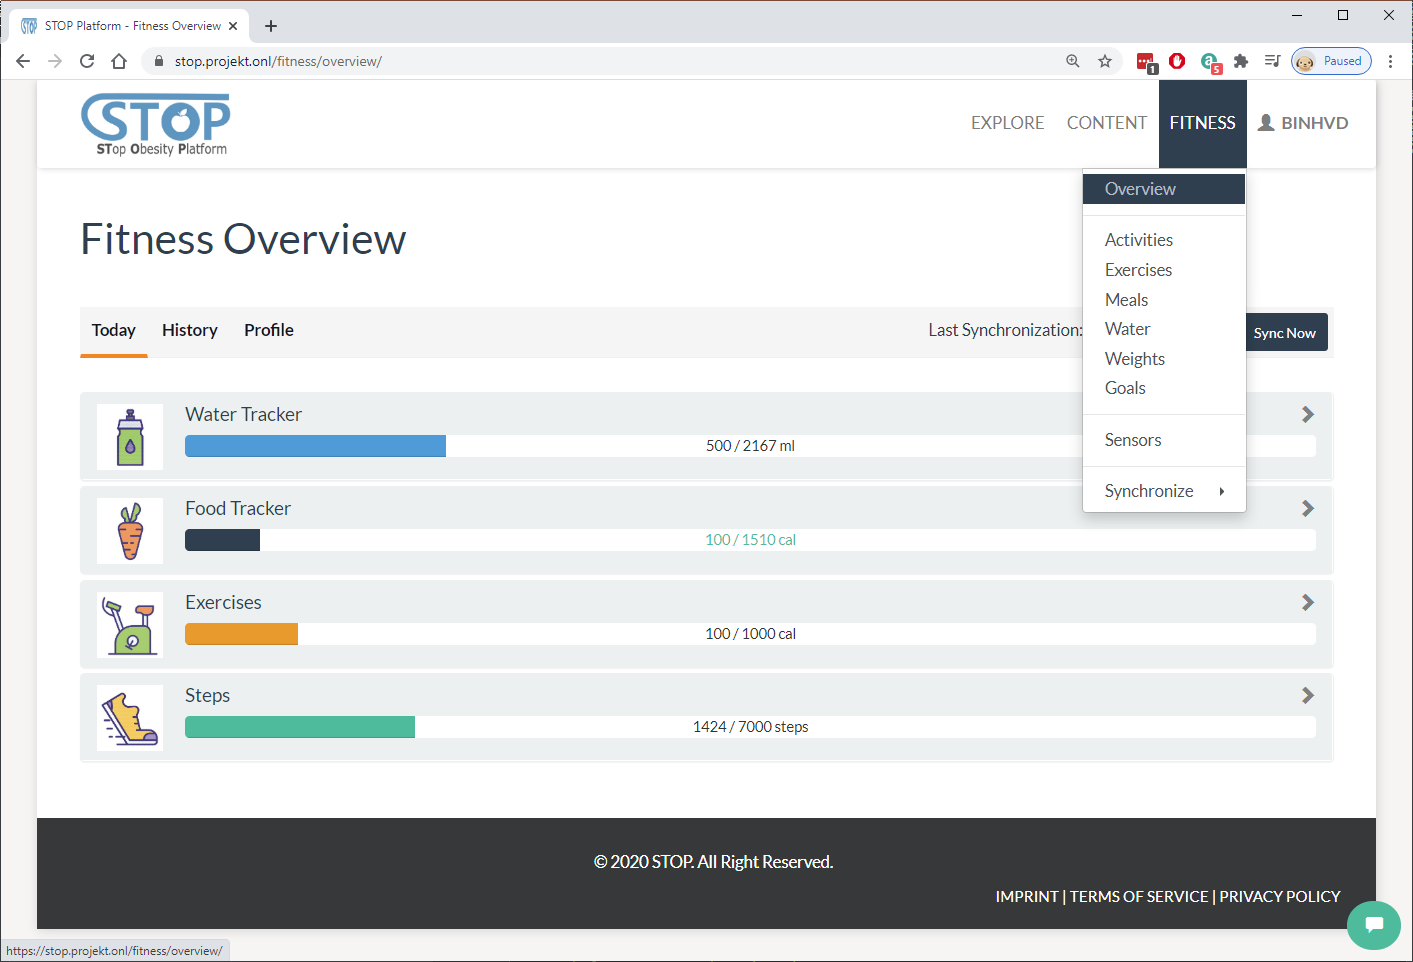
Figure 4‑1: Fitness overview minimized
Each category in the Fitness Overview can be expanded or hidden. The “Today” tab shown in Figure 4-2 provides a quick overview of water consumption, food consumption, exercise, or activity by listing all records belong to these categories created in the current day. The Add buttons provide quick access for the users to add more record. Users can quickly import new data from their wearable device by clicking on the “Sync Now” button without going to the Synchronize menu.

Figure 4‑2: Fitness overview maximized
Fitness History
Unlike the “Today” tab, where all data in a day is presented, the “History” tab (Figure 4-3) visualize fitness data from a date range. Users can select a start and end date where they want to visualize all the records created inside this period. After clicked on the “View History” button, a chart with 2 axes will be generated for each category, such as steps, exercises, meals, waters. This helps users to have a better view over their activities over time.
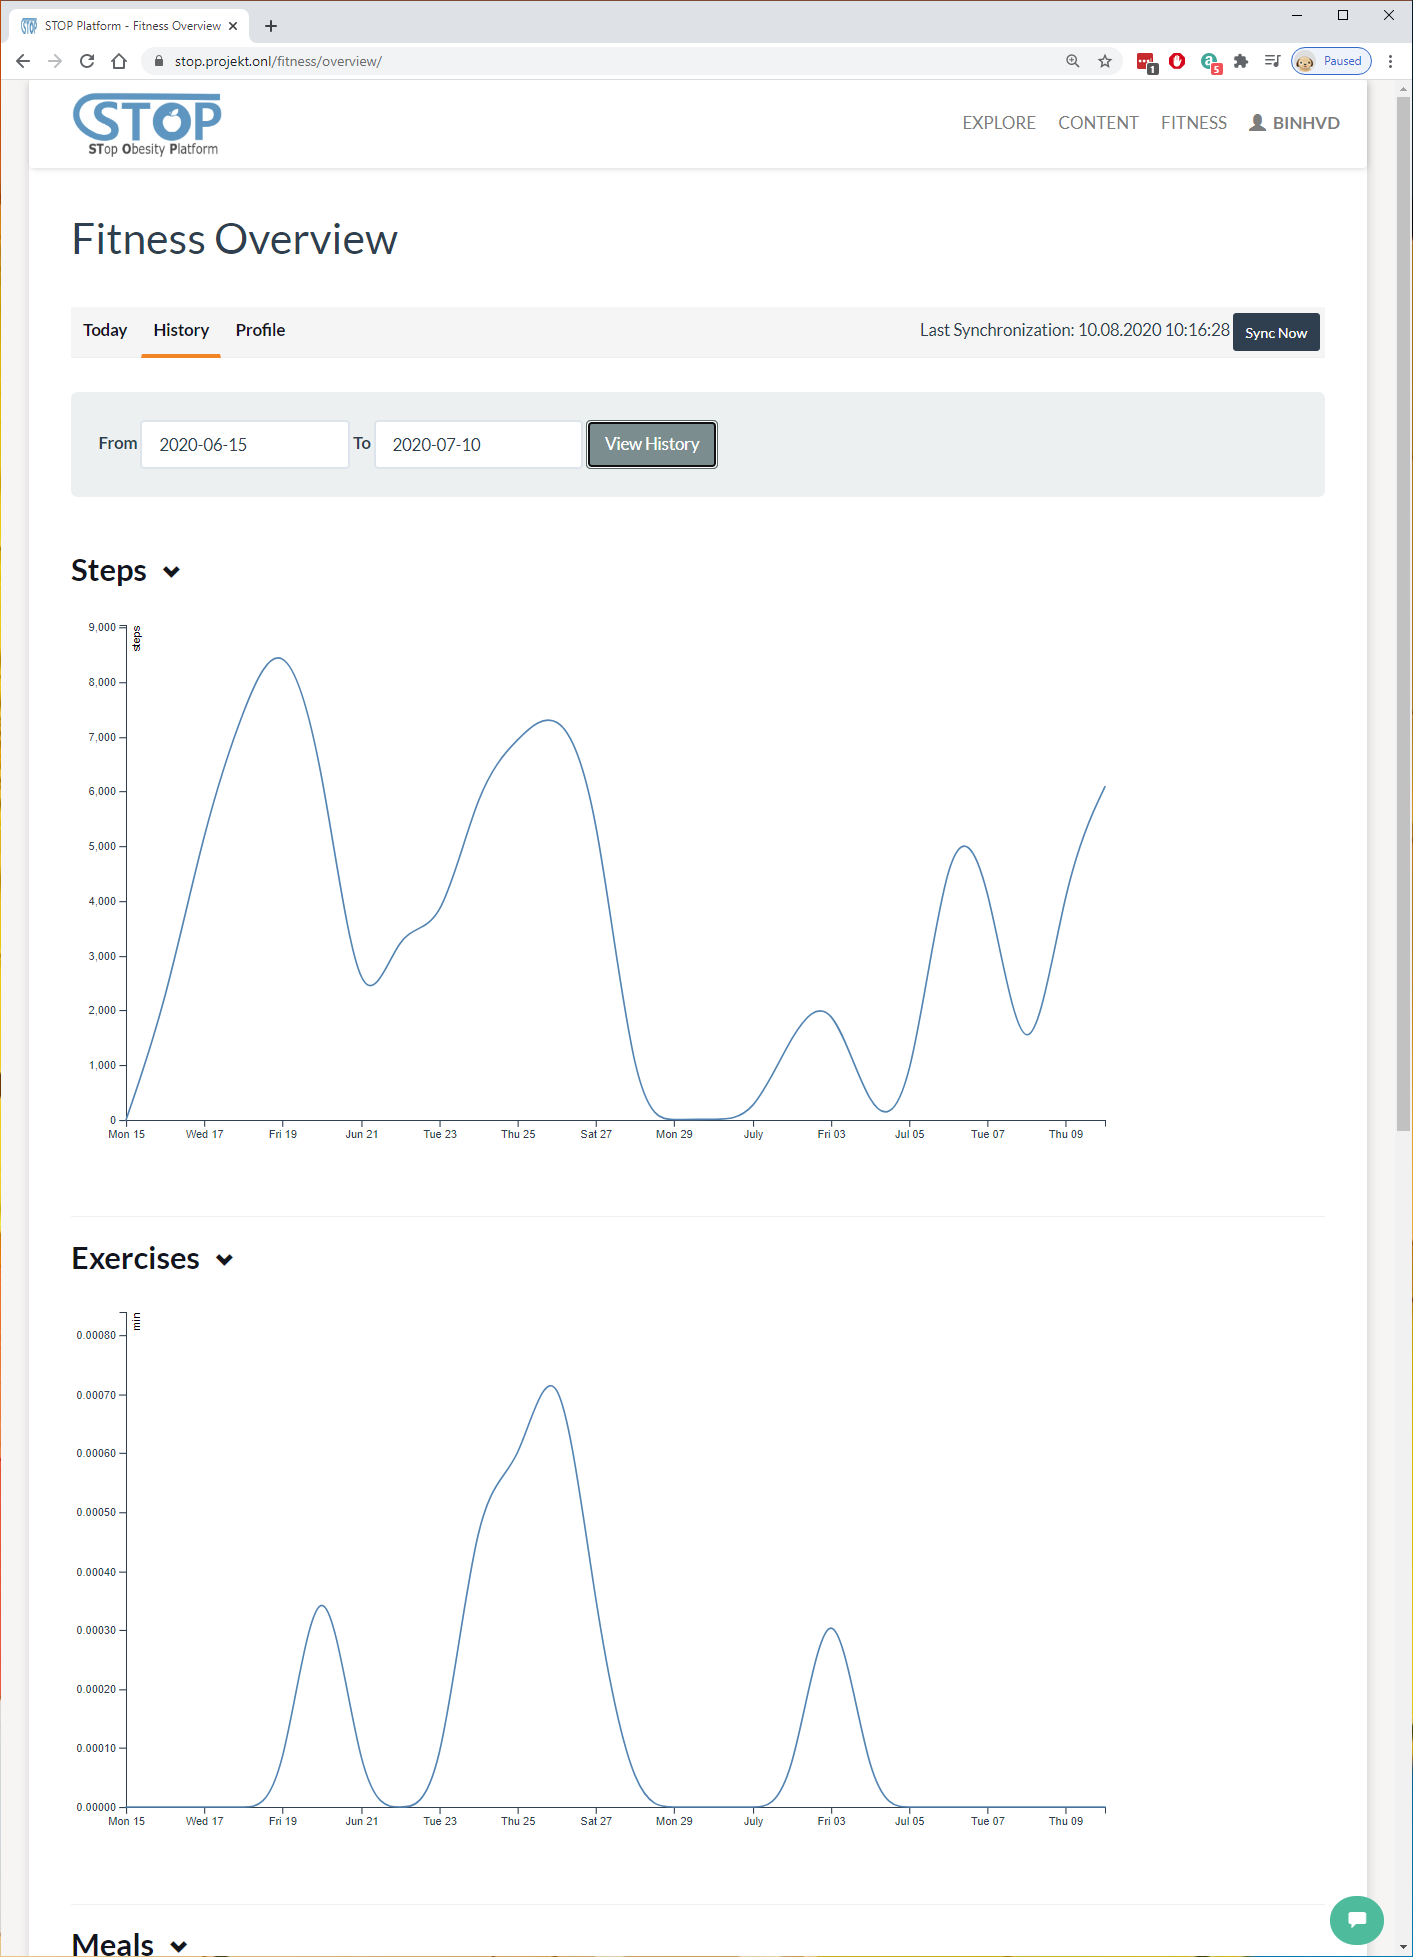
Figure 4‑3: Fitness activities over time
Sensory Dataset
Another visualization users can use is viewing the dataset as shown in Figure 4-4. While viewing a dataset, users can read all information related to it, such as ID, frequency, activity. Furthermore, they can preview the data in the CSV format and download the full file. Finally, a chat with 2 axes that visualize that data is presented.
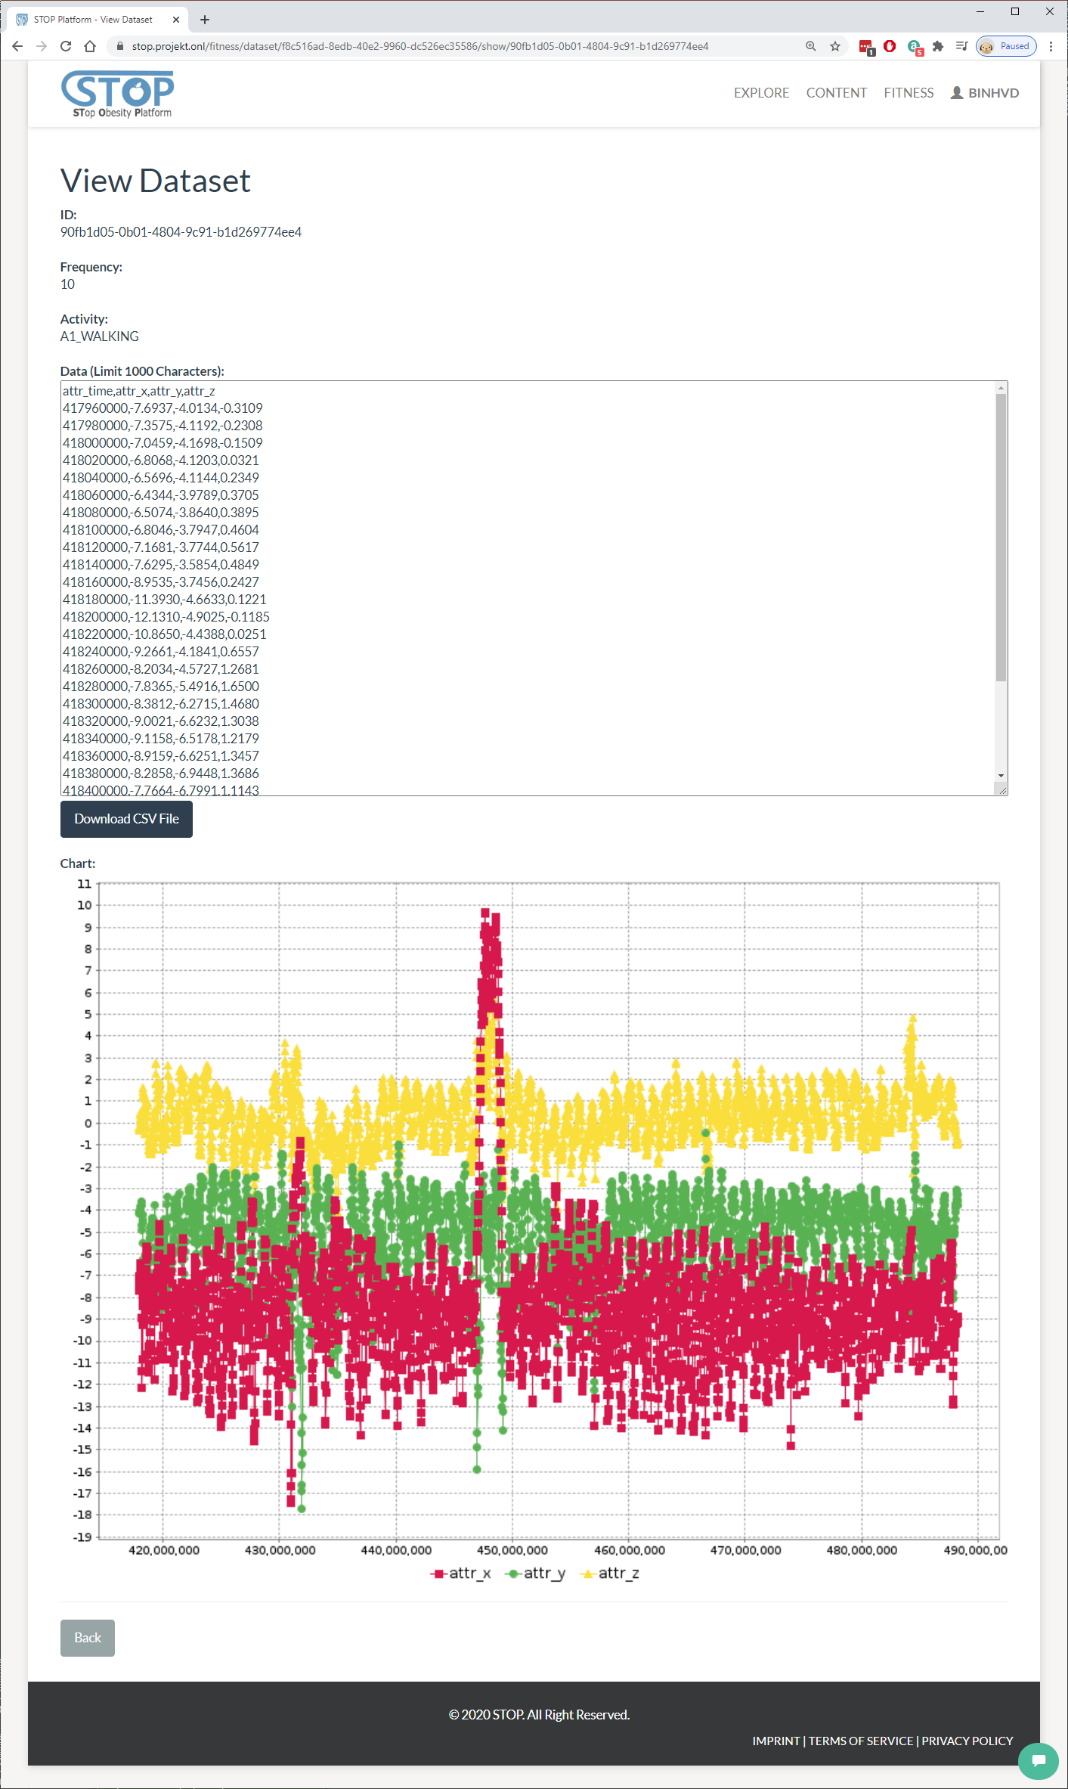
Figure 4‑4: View a dataset
Feasibility Study Preparation
The output of this deliverable is in the mean of a demonstration. Beside the screenshots presented in this document, a demonstration video can be found here:
The video was uploaded to the STOP portal and published using the same knowledge management system presented in this document.
Furthermore, the STOP Data and Knowledge Management, Pre-Processing, and User Interaction that was shown here will be re-used in the feasibility study, which is scheduled in the next few months. The system then can be extended and adapted based on the result of this study.
The procedure as well as result of the feasibility study will be reported in another deliverable.

Deliverable D2.2
STOP Data and Knowledge Management, Pre-Processing, and User Interaction layer first release
|
Work Package |
Data and Knowledge Management, Pre-Processing and User Interaction- Component and Service Refinement and Implementation |
|
Task(s) |
|
|
Author(s) |
Binh Vu, Felix Engel |
|
Document ID |
D2.2_ STOP Data and Knowledge Management, Pre-Processing and User Interaction layer first release_M18 |
|
Approver |
Matthias Hemmje |
|
Creation date |
11/08/2020 |
|
Last update |
21/09/2020 |
|
Version |
2020.09.21_final |
|
Supersedes |
NA |
|
Dissemination Level |
PU |
*All dates in dd/mm/yyyy format
Document Log
|
Date |
Author |
Changes |
Version |
Status |
|
11/08/2020 |
Binh Vu |
ToC |
2020.08.11_V1 |
draft |
|
12/08/2020 |
Binh Vu |
Add section 3, 4, 5 |
2020.08.12_V1 |
draft |
|
18/08/2020 |
Felix Engel |
Revision of section 1, 2, and 3 |
2020.08.13_V1 |
draft |
|
18/08/20 20 |
Binh Vu |
Update section 2, 3, 4 |
2020.08.18_V1 |
draft |
|
21/08/2020 |
Binh Vu |
Refer figures in text |
2020.08.21_V1 |
draft |
|
04/09/2020 |
Binh Vu |
Update section 1 |
2020.09.04_V1 |
draft |
|
17/09/2020 |
Binh Vu |
Update section 5 |
2020.09.17_V1 |
draft |
|
21/09/2020 |
Felix Engel |
Edit section 1 |
2020.09.21_final |
final |
Contents
2 Data and Knowledge Management: Cognitive Walkthrough 7
2.1.3 Fitness Data Importing 12
2.1.7 Water Consumption Manager 28
2.2.4 Content and Knowledge Importing 48
2.2.6 Content and Knowledge Searching 54
3 Sensory Data Fusion: Cognitive Walkthrough 55
5 Feasibility Study Preparation 63
Introduction
The STOP project will address the health societal challenge of obesity with the specific objectives of mitigating the enormous and growing Health Care costs of obesity and related health issues. The project proposed solution is the foundation of an innovative platform to support Persons with Obesity (PwO) with better nutrition under the supervision of Healthcare Professionals. Therefore, the STOP Platform will capture various PwO data from different kind of smart sensor streams and Chatbot technology, manage and enrich available data with existing knowledge bases and fuse these by machine learned driven Data Fusion approaches for sophisticated AI data analysis.
The WP2 has a strong relation with other WPs, especially in refining and implementing of the STOP platform architecture which is for convenience as well depicted in Figure 1-1. To provide a better overview of the integration of this report with the architecture, we will shortly summarize some key points. The architecture contains a Persistant Layer (located in the cloud), which consists of a Structured Content area (Digital Library and Multimedia Archive) for the Content and a Knowledge Network (KN) for KOs (details see D2.1). The KM-EP is based on a flexible integration architecture with service harmonization capabilities (an architecture about KM-EP could be found in D2.1).

Figure 1‑1: STOP Platform Architecture Data & Knowledge Ecosystem
As marked with different colours in the figure, the platform is combined the works of WP2 and WP3. Overall, the project Work Package 2 (WP2), which is described in this deliverable, is focused on topics related to:
- Sensory Data Fusion: Merging raw data with captured data into KOs
- Data & Knowledge Management – KM-EP: Manages the SDF input and output
- Information Visualisation: Visualise the Content and Knowledge
Other parts of the STOP platform, such as e.g. AI Chatbot and Gamification App, are reported in other deliverables. This report is the second deliverable of the work package 2 with scope on the first STOP Platform release that is conceptualised in the deliverable 2.1 (see Figure 1-2).
Figure ‑: Relation of STOP deliverables
The aim of this report is to document the project achievements to the following objectives:
- O2.2: Conduct software implementation and refinement activities of policies and workflows to enable access and use of data and meta data, managed through the STOP Platform, besides establishing security functionalities, Semantic Data Integration and Fusion.
- O2.3: Conduct software implementation and refinement activities, of innovative Visualisation algorithms and techniques to support case pilot specific user interaction with managed data.
To address the scope of this report and above objectives, project work in WP2 is split in in five tasks. The structure of this report will follow the order of tasks (from DoA) that are already worked in during various secondments. The first four tasks are already relevant for this report and copy and pasted for convenience:
- T2.1 Task lead: CIT. Contributors: FTK, Sensory interfaces Implement an initial selection of sensory interfaces for the STOP Platform. These interfaces will provide a generic approach to engage different types of wearable sensors into the STOP Platform. To be further managed and enriched through the Data Management component. (Secondment No. 2, 12, 23)
- T2.2 Task lead: CIT. Contributors: FTK, Data Fusion Research, selection and integration of machine learning algorithms to be used sensory Data Fusion. (Secondment No. 2, 12, 23)
- T2.3 Task lead: FTK. Contributors: CIT, OKK. Data & Knowledge Management: implementation, refinement and documentation Implementation, refinement and documentation of Semantic Data Integration and Fusion functionalities. This will enable broad subsequent processing and data exchange throughout system barriers and comprehensive Knowledge Management with available data. Actually, the semantic Data Fusion could as well be regarded as a semantic information integration process that enables a unified and unique data access interface. Therefore, amongst others a formal extensible ontology will be developed and validated to represent the relevant concepts and relations of the food domain. Address ethical implications that goes along with the platform implementation and refinement of workflow and access functionalities. (Secondment No. 3, 7, 25)
- T2.4 Task lead: OKK. Contributors: CIT, FTK. Visualisation: Implementation, refinement and documentation. An intuitive visualisation dashboard will be designed that is personalised to each user. The visualisation will complete the loop in the quantified-self paradigm by enabling effective feedback for reflection, planning, actionable insights and for self-understanding. The visualisation will be co-designed with users to ensure that it is useful and user-centred. The visualisation will be interactive in nature and will allow the user to interrogate the data on multiple levels of detail where the sophistication and granularity is controlled by the user. Interpretation of the visualisation will be validated using the concurrent think-aloud protocol otherwise known as a cognitive walkthrough with users. Finally, the visualisation will be audited using design principles and heuristics from Gestalt psychology. (Secondment No. 8 & 13).
The report documents four cognitive walk through of the Platform components Data and Knowledge Management, Sensory Data Fusion, and Data Visualisation. Each walkthrough demonstrates stepwise the functionality of the system components with screenshots and their descriptions.
Data and Knowledge Management: Cognitive Walkthrough
In this section, the Data and Knowledge Management developed in the context of the STOP project is presented. The walkthrough is split into a description of the data management functionality for the management of fitness data and a section that reports on the functionality for knowledge management.
Fitness Data Management
Fitness Data Manager supports users in the task of importing, creating, and managing their fitness data. They consist of several modules that helps to manage users’ activities, exercises, food and water consumptions, weights, and goals.
User Registration
Go to the STOP portal at https://stop.projekt.onl/. Users are required to login using their username and password. Unregistered users click on “Register” button to go to the registration page (see Figure 2‑1).

Figure ‑: User registration UI
Users will need to fill in their personal information and choose a username and password to complete the registration process. All optional and required fields are presented in Figure 2‑2.

Figure ‑: User registration form
Fitness Overview
After completed registration and login using username and password, users are required to create a fitness profile. This step is needed for the system to calculate a personalized fitness plan for each user (Figure 2‑3).

Figure ‑: Create a fitness profile
The fitness profile also requires user’s current weight. The current weight could be added through the form shown in Figure 2‑4.

After the fitness profile was created, user can edit it by going to menu Fitness > Overview on the navigation bar. Figure 2-5 shows the editing form.

Figure 2‑5: Edit fitness profile
Fitness Data Importing
Users have the possibility to import their fitness data from a wearable device. By going to menu Fitness > Synchronize > Fitbit, users can access and import data from any Fitbit device (Figure 2-6).

Figure 2‑6: Import from Fitbit
Users will need to authorize the STOP portal to access their fitness data by logging in using their Fitbit account. Figure 2-7 presents Fitbit’s login interface.

Figure 2‑7: Login Fitbit account
After authorized the STOP portal, users will be redirected back to the portal. Here, they can choose to access to new data created since the last import. If users haven’t import data from this service before, the system will suggest to load all data created from the last 3 months.
Users have the option to change the import date then click on the “Load New Records” button to download their fitness data (Figure 2-8).

Figure 2‑8: Load data from Fitbit
After loading fitness data from Fitbit, users can preview them. There are 6 types of fitness data loaded: Activities, Exercises, Weights, Foods, Waters, and Goals. As shown in Figure 2-9, users can click on the “Activities” tabs to browse the activity records. They can also search for specific record by using the search box.

Figure 2‑9: List loaded activities
Similar to activity, users can browse exercise records in the “Exercises” tab. The related data for each exercise is shown in Figure 2-10.

Figure 2‑10: List loaded exercises
Users can look at their weight-related data each day in the “Weights” tab as shown in Figure 2-11.

Figure 2‑11: List loaded weights
If users enter their food consumption, such as food name, consumption time… to their Fitbit account, it will be listed in the “Foods” tab (Figure 2-12).
The same applies to water. It will show how much water user drank each day.

Figure 2‑12: List loaded foods
Finally, the last tab shows the target users added or calculated by Fitbit based on the users’ fitness profile (Figure 2-13).

Figure 2‑13: List loaded goals
After viewing all their data, users click on “Synchronize” button at the end to import them to the STOP portal. The system will show how many records were imported successfully as in Figure 2-14.
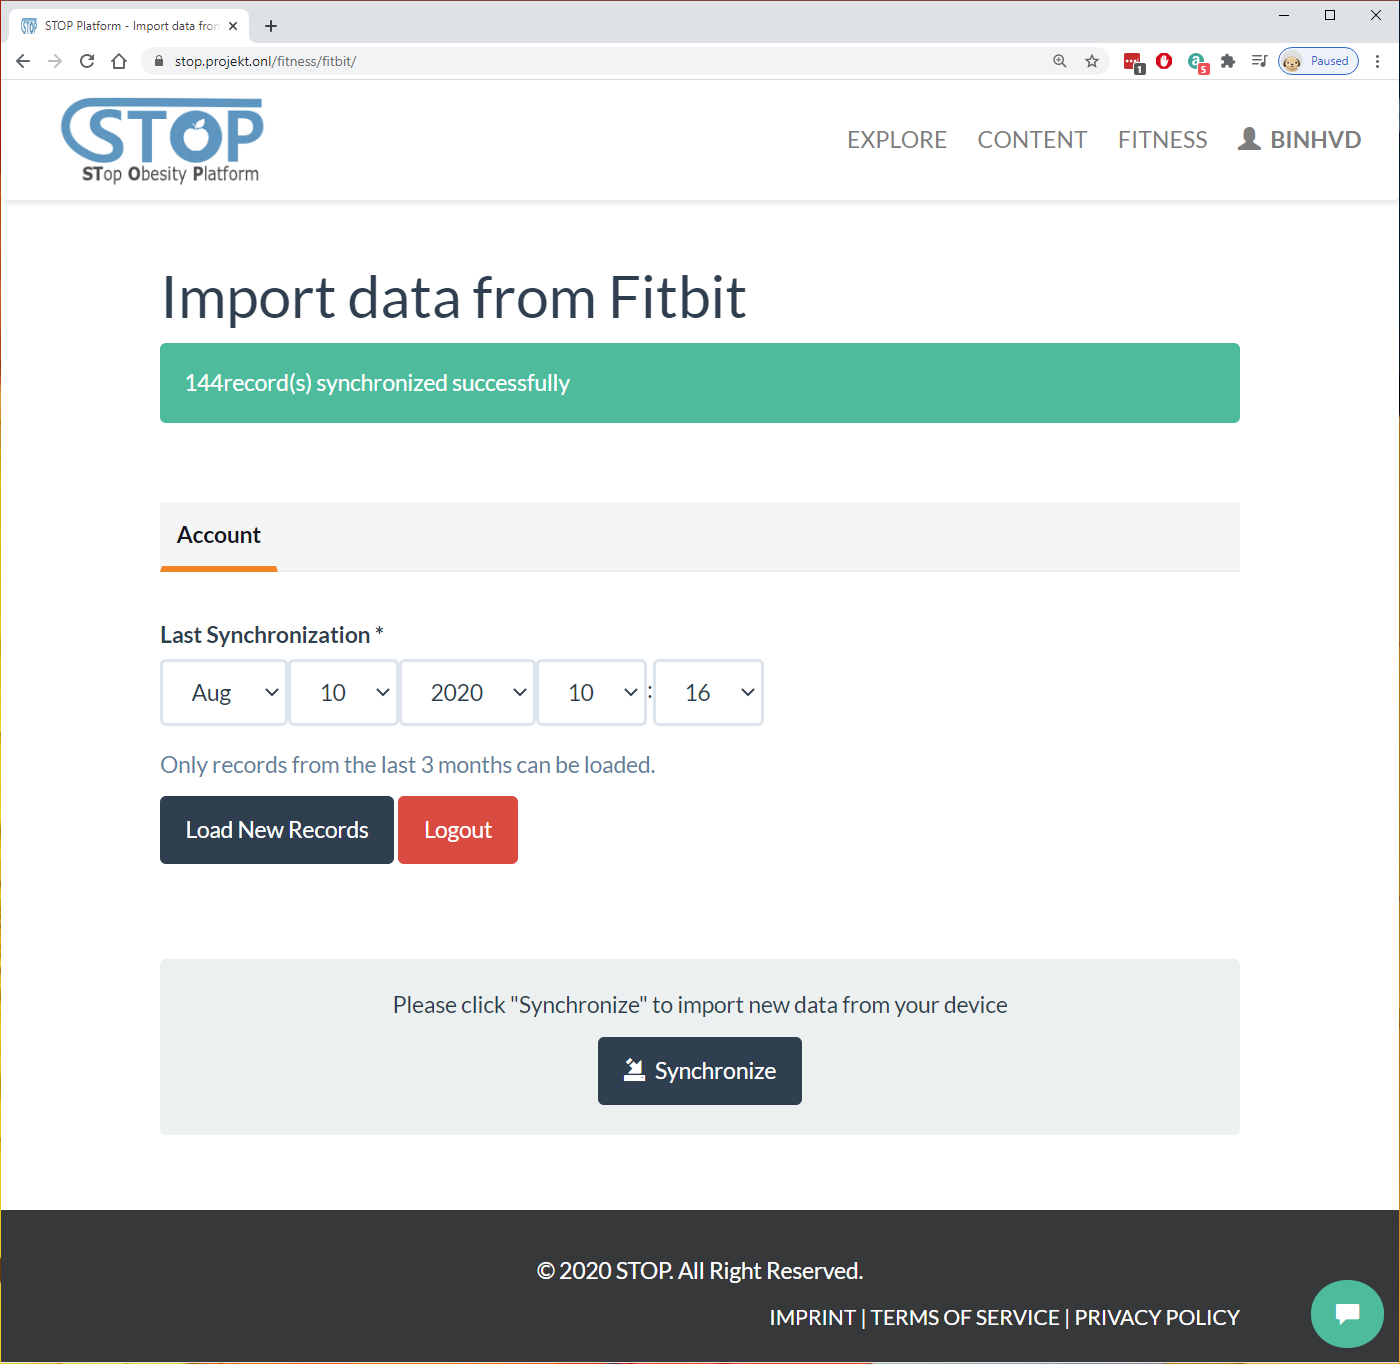
Figure 2‑14: Import data successfully
Activity Manager
After fitness data was imported, users can manage their data in the “Fitness” menu. To manage activity data, users can go to Fitness > Activities menu. In Figure 2-15, all activity records are listed. Users can either edit existing records by clicking on “Edit” button or create a new activity by clicking on “Add Activity”.

Figure 2‑15: List created activities
In the “Add/Edit Activity” page as shown in Figure 2-16, users need to fill out the required fields, such as “Log Date”. Other fields, such as “Log Time”, “Distance”, “Steps”, are optional. After filling out all the information, users click on “Create/Save” to create a new activity or save the edited record. Furthermore, users can also click on “Cancel” button to come back to the listing page.

Figure 2‑16: Edit an activity
On the listing page, users click on the “Delete” button of a record to remove this record from the database. The system will ask for users’ confirmation to make sure that they have not clicked on this button by mistake (Figure 2-17).

Figure 2‑17: Delete an activity
Exercise Manager
Next to “Activities” menu is the “Exercises” menu, where users can manage their exercise records (Figure 2-18). Similar to “Activities”, users can click on “Edit” button to edit existing record or “Add Exercise” button to create a new exercise.
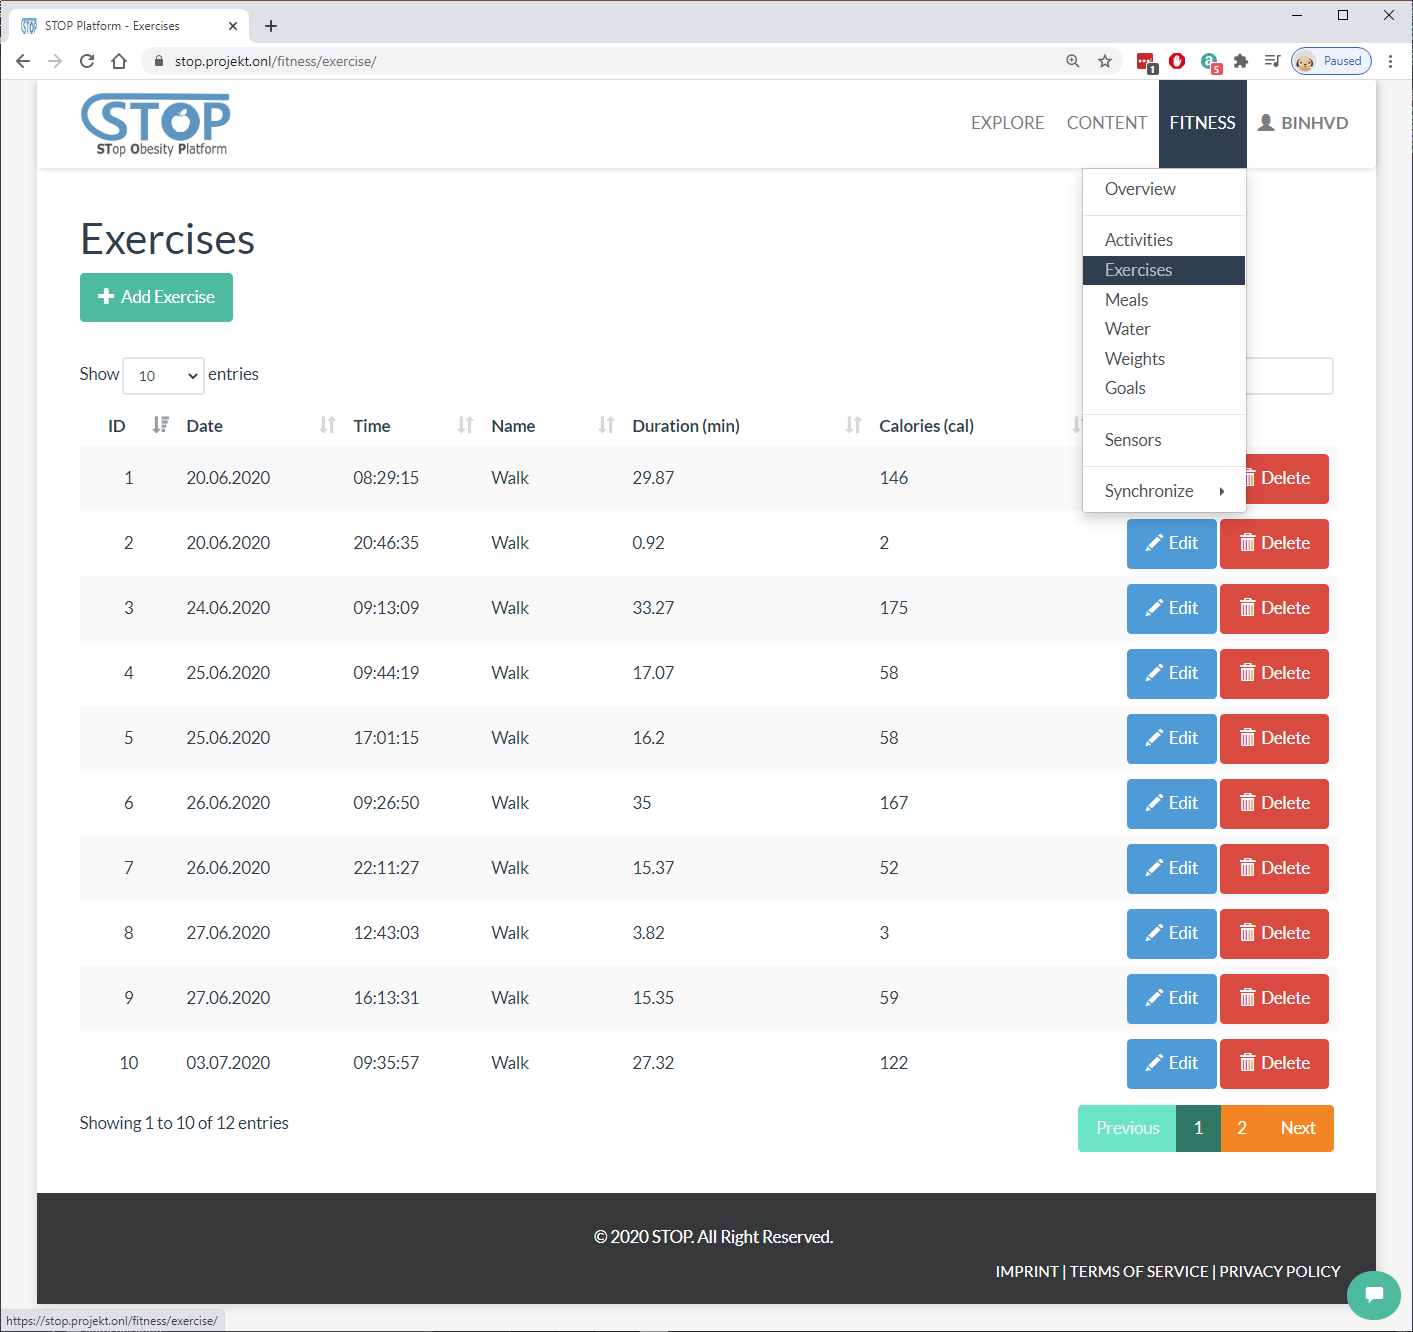
Figure 2‑18: List created exercises
In the “Add/Edit Exercise” page shown in Figure 2-19, users will need to fill out the information related to their exercise, such as name, date, description, distance, etc. After completed this step, users click on the “Create/Save” button to save the input to the database. Users can stop this process and go back to the listing page anytime by clicking on the “Cancel” button.
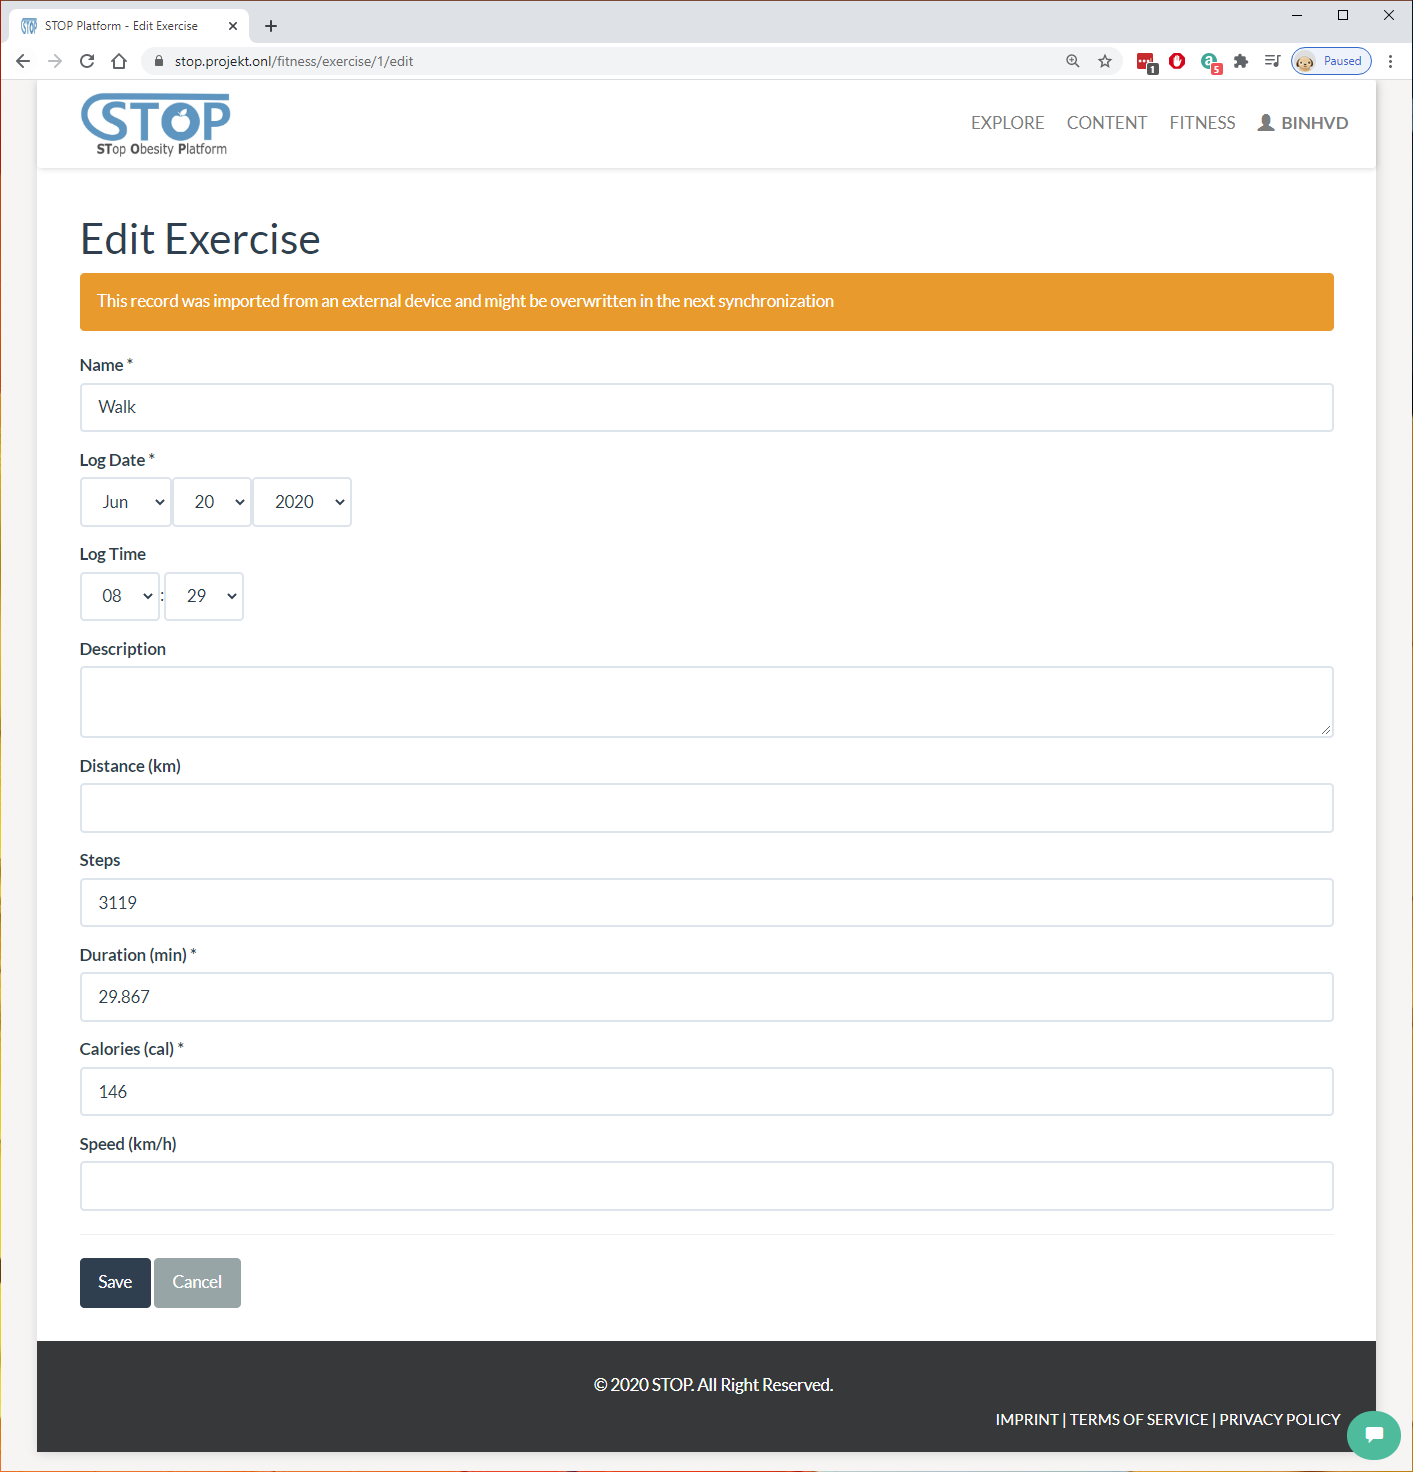
Figure 2‑19: Edit an exercise
On the listing page, users can delete a record by clicking on the “Delete” button at the end of the row. Figure 2-20 shows the system asking users once more time before removing the record from the database.
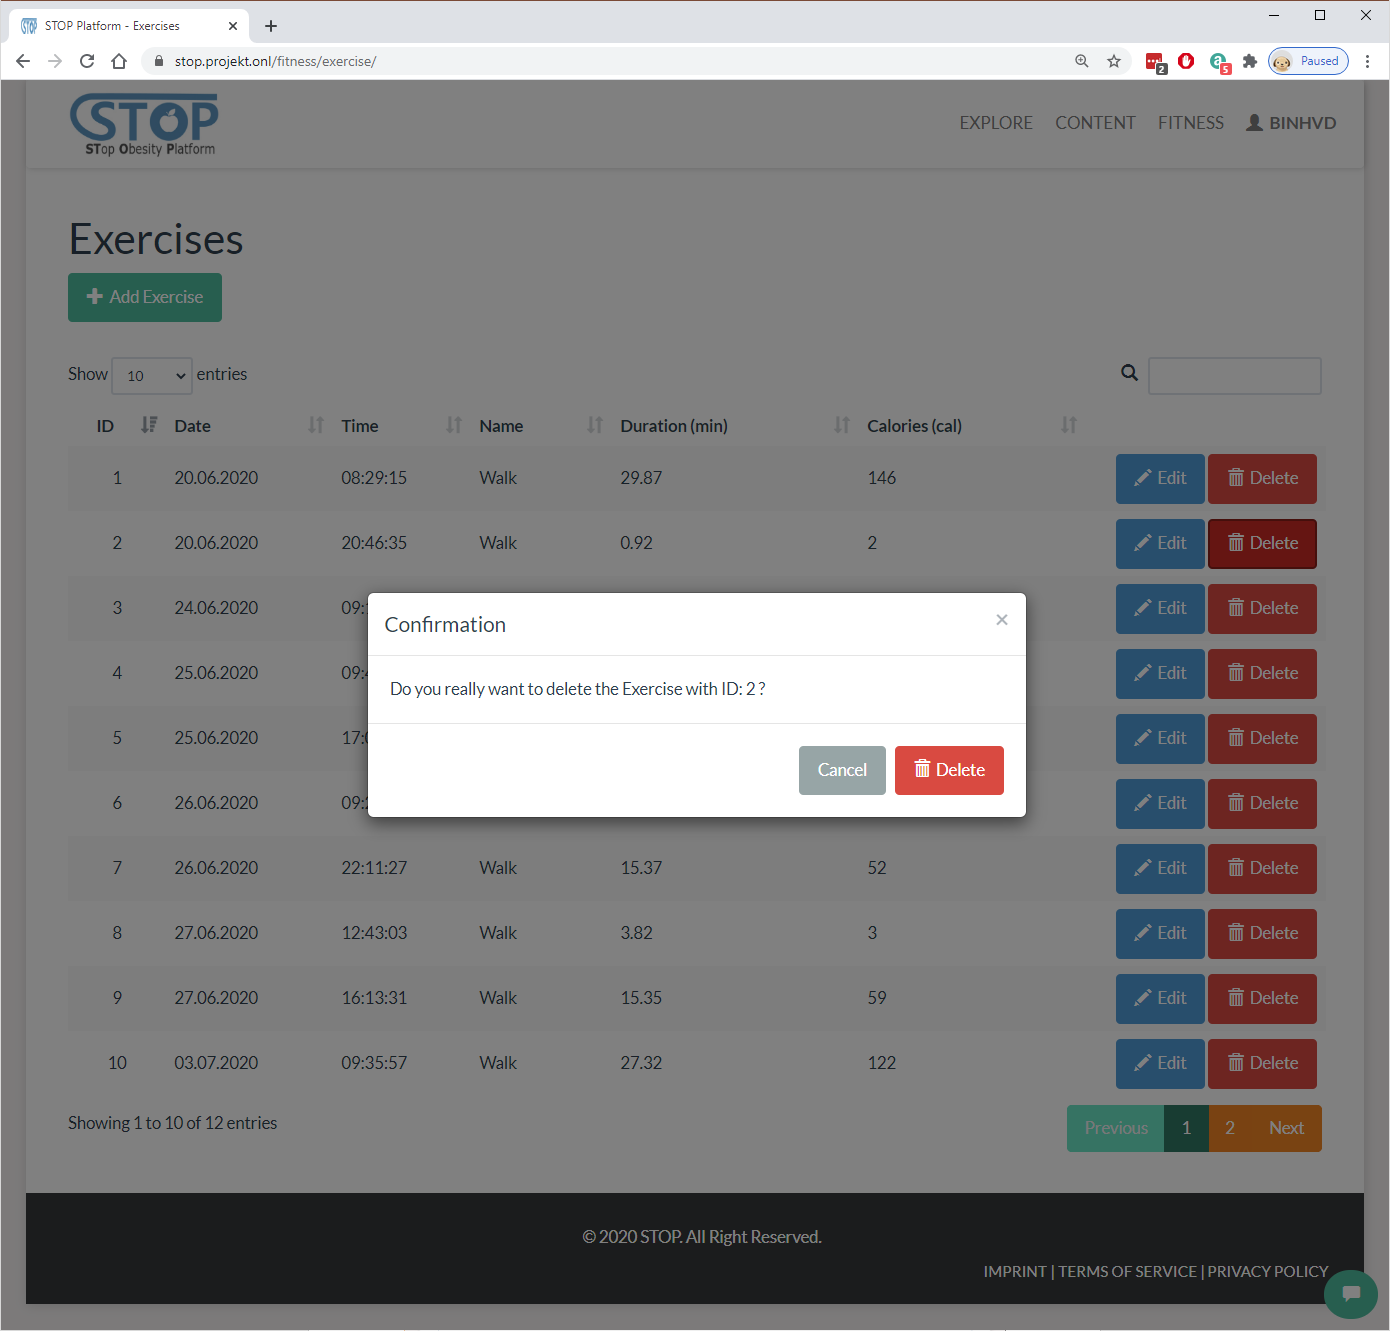
Figure 2‑20: Delete an exercise
Meal Manager
Users can manage their food consumption by selecting Fitness > Meals menu (Figure 2-21). Here they can ask the system to suggest a recipe for their next meal or add a meal that they just ate. Furthermore, users can edit the created record in the list.

Figure 2‑21: List created meals
In the “Add/Edit Meal” page in Figure 2-22, users will need to add the food they ate in the meal then click on the “Create/Save” button to save the input to the database. Otherwise, users can stop this process and go back to the listing page anytime by clicking on the “Cancel” button.

Figure 2‑22: Add a meal
Similar to other type of data, users can delete a meal record by clicking on the “Delete” button at the end of the row. The system will need users’ confirmation once more time before removing the record from the database as shown in Figure 2-23.

Figure 2‑23: Delete a meal
Water Consumption Manager
Users can manage their water consumption by selecting Fitness > Water menu. Here they can add a drink record to the system or edit the added drink in the list shown in Figure 2-24.

Figure 2‑24: List created water consumptions
In the “Add/Drink Water” page as shown in Figure 2-25, users fill out the timestamp and volume of the drink then click on the “Create/Save” button to save it to the database. Otherwise, users can stop this process and go back to the listing page anytime by clicking on the “Cancel” button.
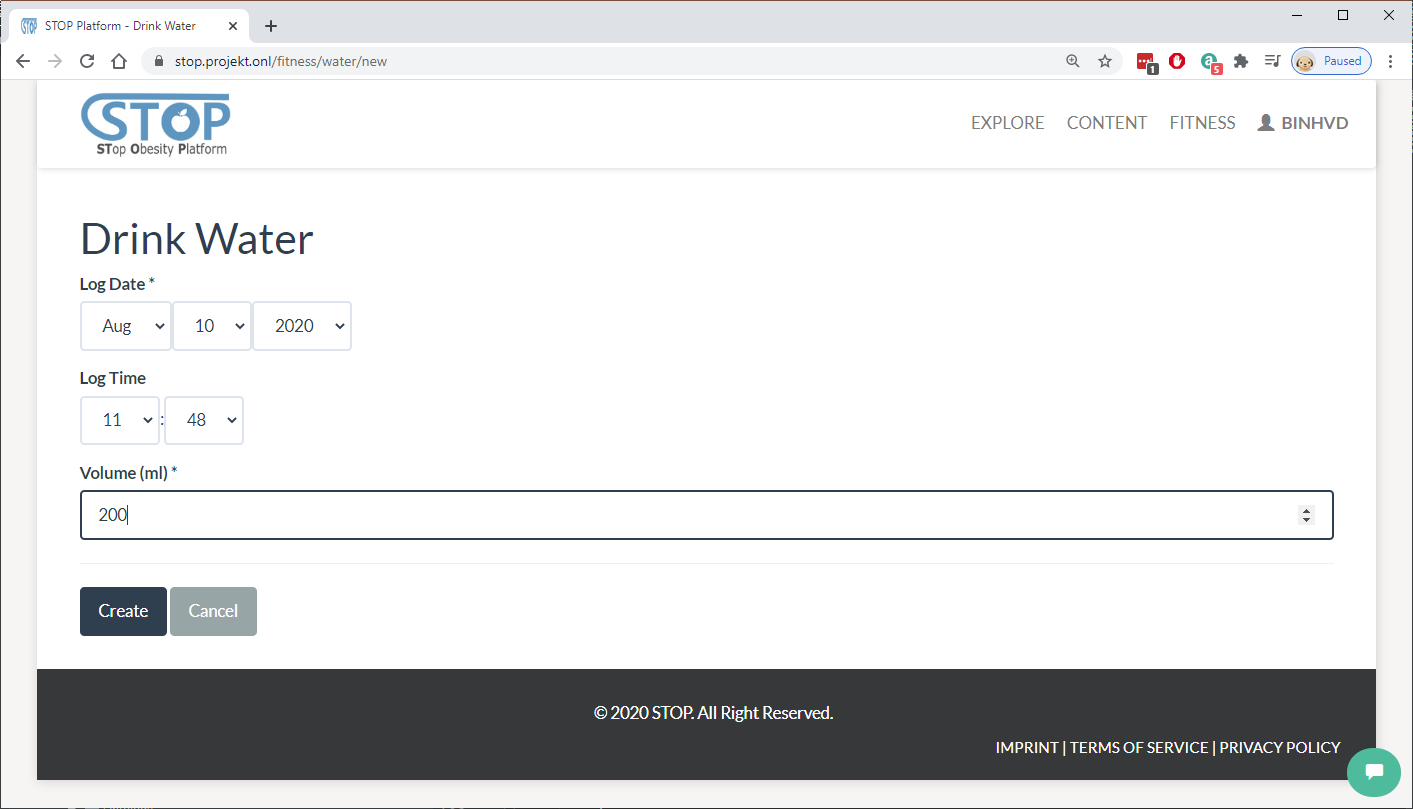
Figure 2‑25: Drink water
In the listing page, users can delete a drink by clicking on the “Delete” button at the end of the row. The system will ask users if they are sure before removing the drink from the database (Figure 2-26).

Figure 2‑26: Delete a water consumption
Weight Manager
In the Fitness > Weights menu, users can manage the changes of their weight over time. Here they can add, edit, or delete their weight records. Figure 2-27 shows the list of user’s weight records.

Figure 2‑27: List created weight records
In the “Add/Edit Weight” page in Figure 2-28, users type in their weight along with BMI and Fat value then click on the “Create/Save” button to save them to the database. Users can also click on the “Cancel” button to stop this process and go back to the listing page.
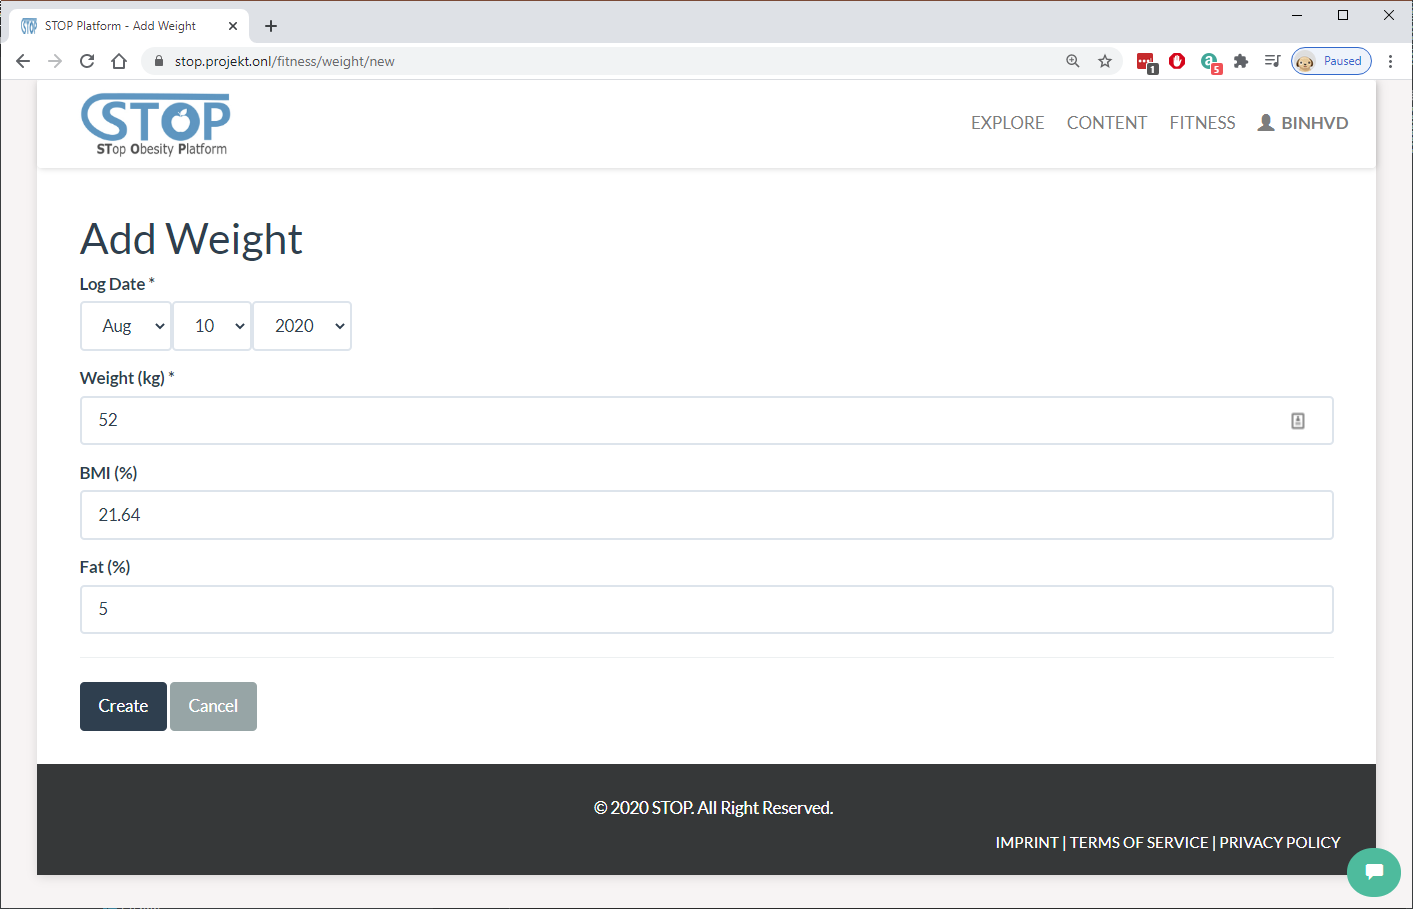
Figure 2‑28: Add a weight record
In the listing page presented in Figure 2-29, users can delete a record by clicking on the “Delete” button at the end of each row. The system will ask users if they are sure before removing the record from the database.

Figure 2‑29: Delete a weight record
Goal Manager
Finally, users can manage their fitness goals by going to the Fitness > Goals menu. Here, goals imported from fitness services and created by the users in the portal are listed. Users can create, edit, or delete them from the database as illustrated in Figure 2-30.
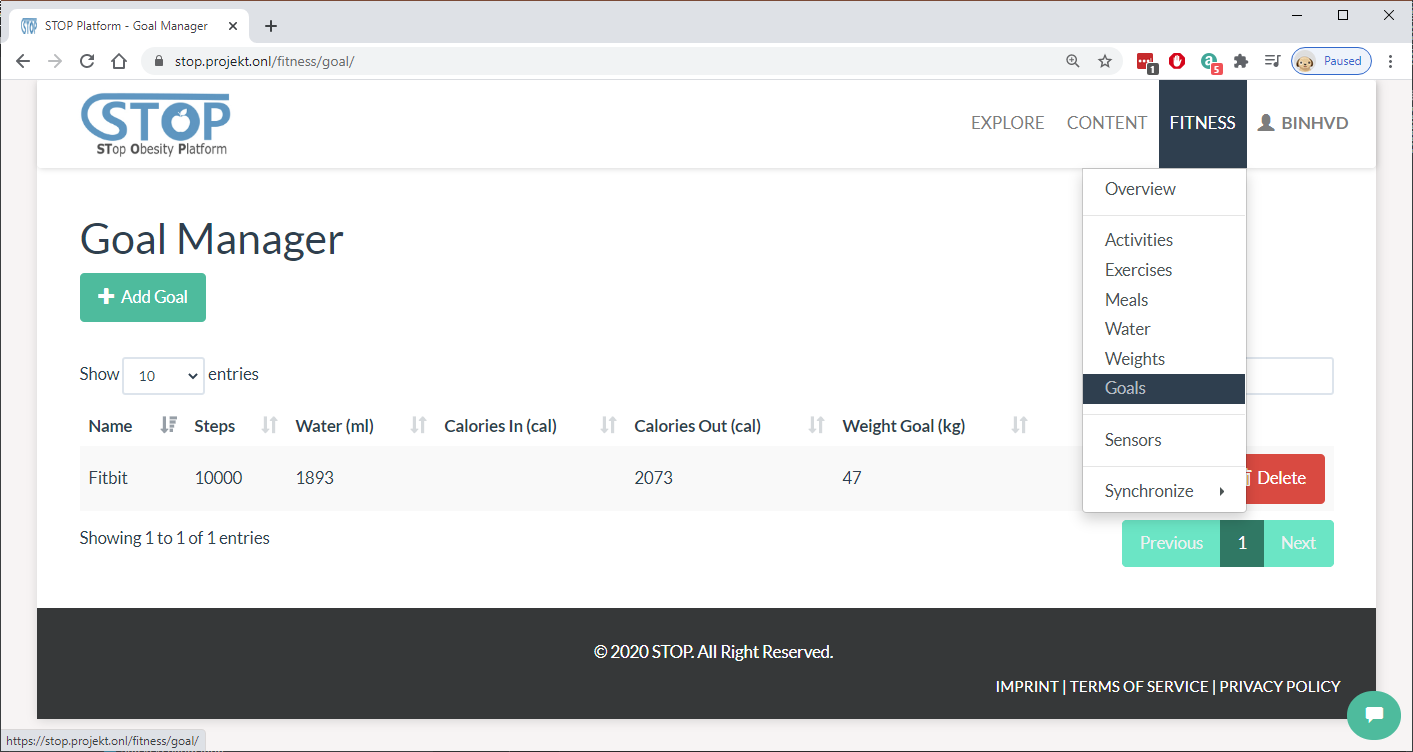
Figure 2‑30: List created goals
In the listing page, users can delete a goal by clicking on the “Delete” button at the end of each row. Figure 2-31 shows the system asking users if they are sure before removing the goal from the database.

Figure 2‑31: Delete a goal entry
After clicking on “Edit” or “Add Goal” button, users will be directed to the “Add/Edit Goal” page. Here, users fill out the needed information then click on the “Create/Save” button to save them to the database. Furthermore, users can click on the “Cancel” button to go back to the listing page as shown in Figure 2-32.

Figure 2‑32: Edit a goal entry
After new goals were created, users can select between them and “Auto Calculation” in the Fitness Profile anytime (Figure 2-33). This will change the user’s target for each day in the Fitness Overview visualization.

Figure 2‑33: Change goal profile
Knowledge Management
This system manages all content and knowledge in the STOP portal. New content and knowledge can either be created by the users or imported from external files and services.
Publication Manager
Users can manage publications in the Content > Publication menu. Here, they can create, edit, and delete publication records in the database. Users can also view a publication by clicking on its title. Figure 2-34 shown the management page.

Figure 2‑34: List created publications
In the Adding/Editing page in Figure 2-35, users need to fill out the metadata for the publication. The metadata is split into several groups, such as authors, identifiers, publishers, etc. In “Multimedia” group, users are able to upload and manage PDF files for the publication.

Figure 2‑35: Edit a publication
In the listing page, users can delete a publication by clicking on the “Delete” button at the end of each row. The system will ask users if they are sure before removing the publication from the database (Figure 2-26).

Figure 2‑36: Delete a publication
In figure 2-37, the “Content Display” page shows the metadata and download a publication. Here, users can view related information such as title, authors, description, etc. Furthermore, they can rate the quality of the publication as well as share it on the social networks.

Figure 2‑37: View a publication
Multimedia Manager
Users can manage multimedia in the STOP portal by selecting the Content > Multimedia menu. Figure 2-38 illustrates the record list. Here, they can create, edit, and delete multimedia records in the portal. Users can also view a multimedia’s metadata and download it by clicking on its title in the listing table.

Figure 2‑38: List created multimedia
After clicking on the “New Multimedia” or “Edit” button, users are directed into the “New/Edit Multimedia” page as shown in Figure 2-39. Similar to Publication, users need to fill out multimedia metadata and upload data here. There are different types of multimedia, such as video, presentation, audio, zip. Depend on the multimedia type, users will be able to upload different data.

Figure 2‑39: Edit a multimedia
In the listing page, users can delete a publication by clicking on the “Delete” button at the end of each row. Figure 2-40 shows the system asking users if they are sure before removing the publication from the database.

Figure 2‑40: Delete a multimedia
Users are able to look at a multimedia metadata and download or play it content in the “Content Display” page as presented in Figure 2-41. Here, users can read important information such as multimedia title, description, authors, etc. Furthermore, they can also rate this content and share it on different social networks.

Figure 2‑41: View a multimedia
Taxonomy Manager
Taxonomy is an important type of content that allows users to use it to classify content in the STOP portal. To manage taxonomies, users need to go to the Content > Taxonomy menu. In figure 2-42, taxonomies created by the users are listed for viewing, editing, and deleting. Furthermore, users can create new taxonomy by clicking on the “New Taxonomy” button.

Figure 2‑42: List created taxonomies
In the “New/Edit Taxonomy” page, users are able to create a new taxonomy or edit an exiting taxonomy (Figure 2-43). Users will need to fill out the related information such as taxonomy title, keywords, description, and authors. In the “Structure” tab, users are provided with a taxonomy building tool that supports user in the construction and management of a taxonomy.
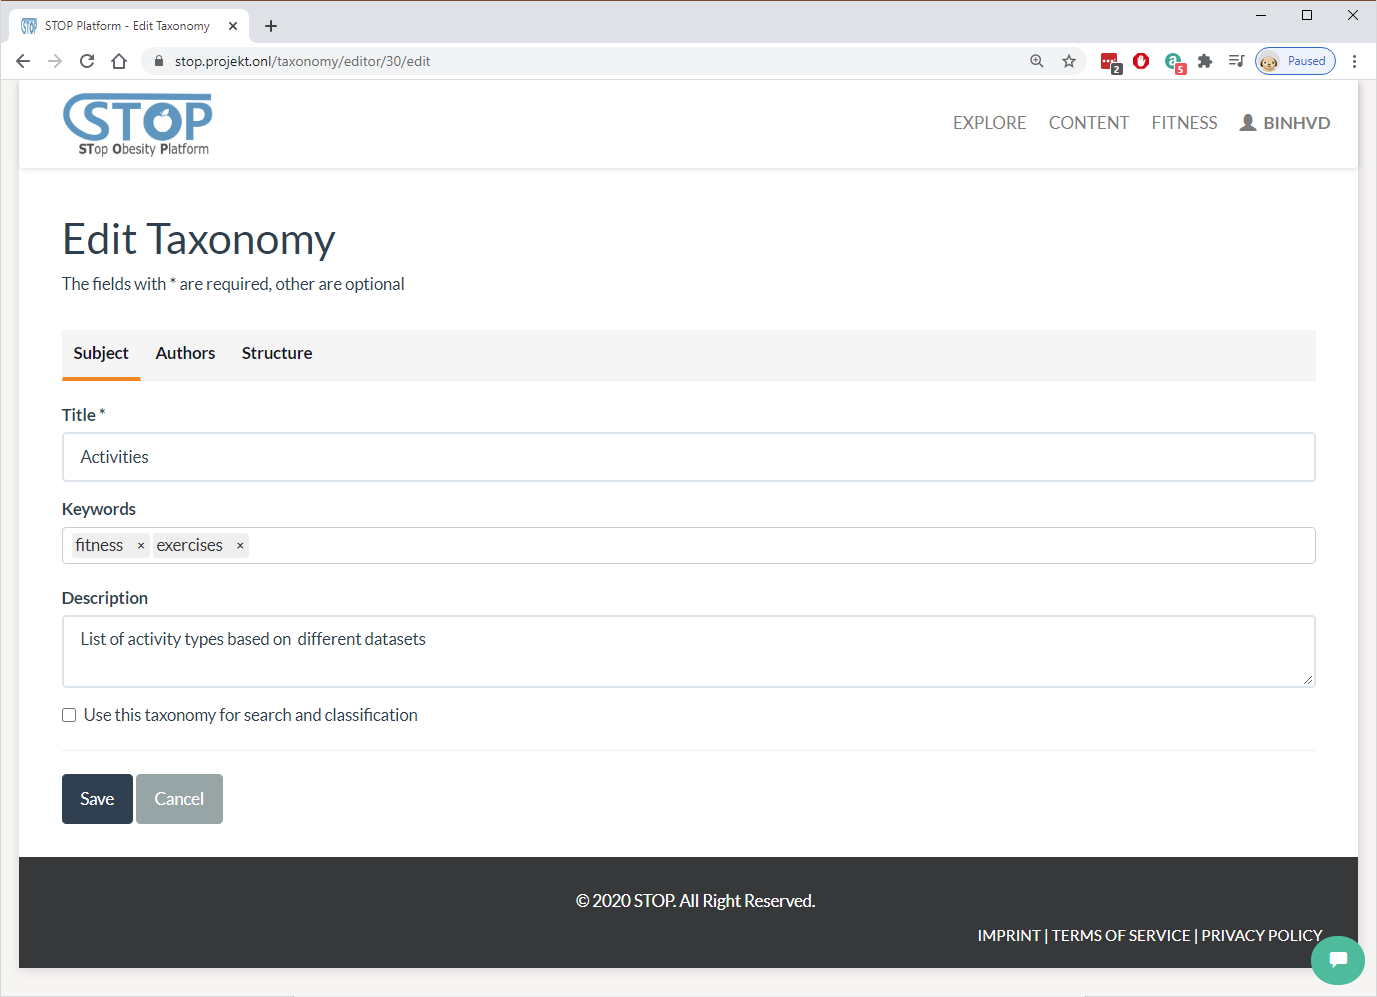
Figure 2‑43: Edit a taxonomy
In the listing page, users can delete a publication by clicking on the “Delete” button at the end of each row. The system will ask users if they are sure before removing the publication from the database. Figure 2-44 presents the deleting page.

Figure 2‑44: Delete a taxonomy
Figure 2-45 presents the “Taxonomy Display” page, where users can view the metadata of a taxonomy, its structure, and are able to export it into different formats. Similar to publication and multimedia, users can see the current rating of the viewing taxonomy and rate it by selecting the stars in the top of the page. They are also able share the content on social networks. In the right panel, the system will suggest content that is similar to the viewing taxonomy.

Figure 2‑45: View a taxonomy
Content and Knowledge Importing
Content can be imported from different formats, such as BibTex and OAI-PMH, and external services, such as Mendeley, SlideShare, GibHub, StackExchange, DSpace, and Youtube, to the STOP portal. To do so, users need to go to the Content > Ingest menu. Here, they can select one of the services to start the import process (Figure 2-46).

Figure 2‑46: Import a question from StackExchange
After choosing the content that needs to be imported, the system will direct users to the Import Wrapper Manager (Figure 2-47). It is where the mapping table, which tells the import system which fields from the external service can be copied to which fields in the STOP database, is managed. Here, users can change, delete, import, and export the mapping setting. After making sure the mapping is correct, users click on the “Import” button to start the importing process.
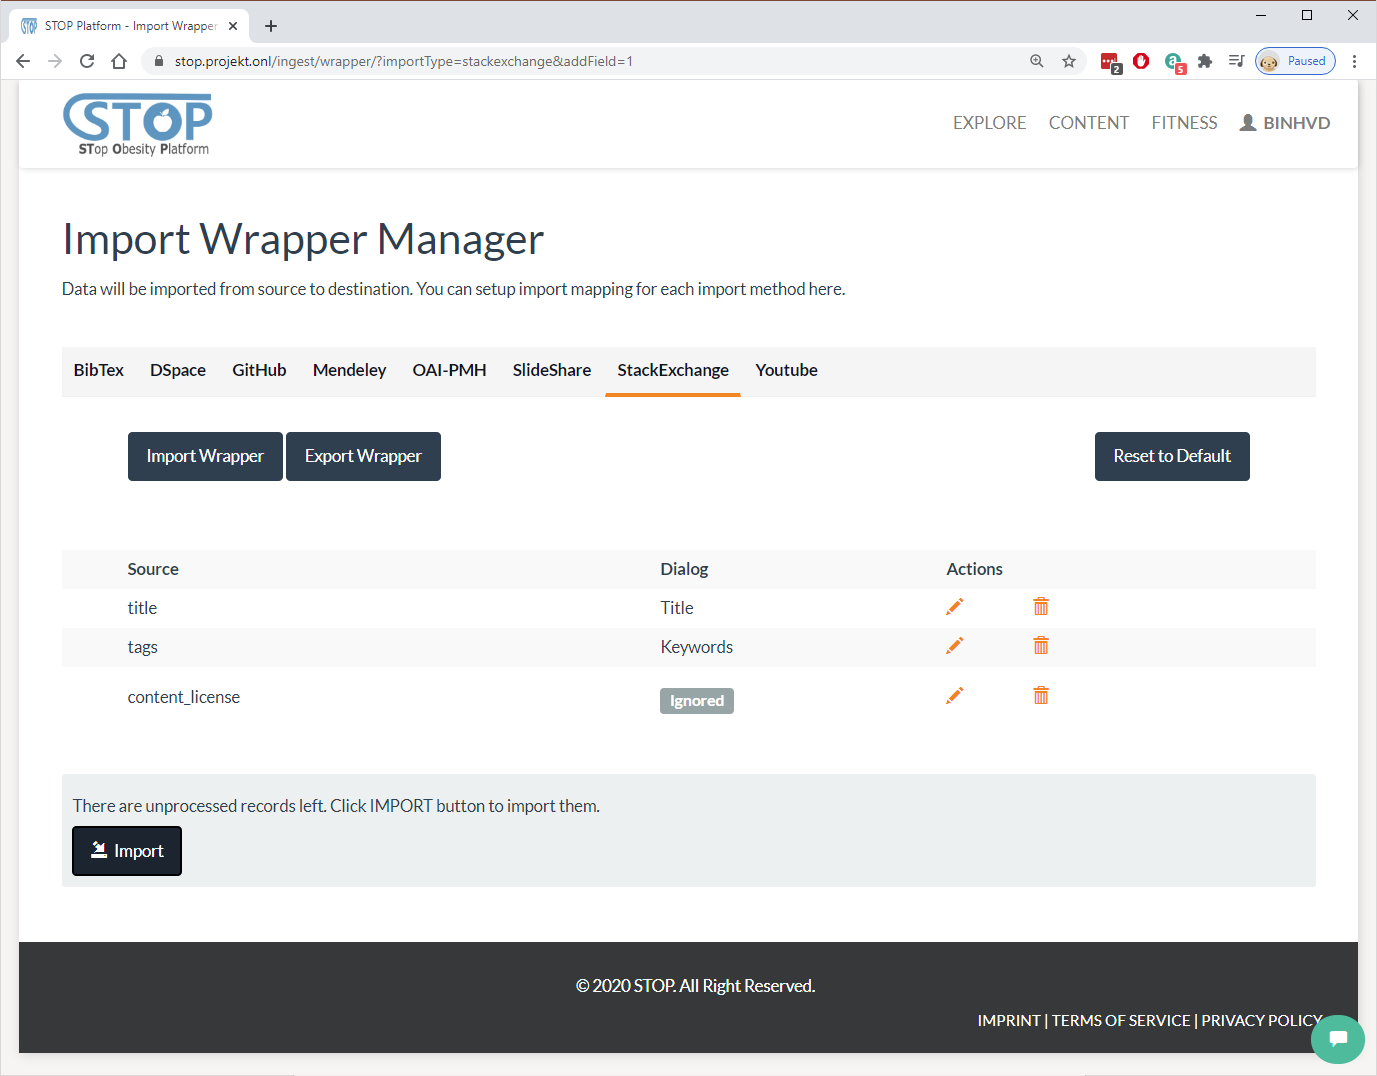
Figure 2‑47: Edit StackExchange’s wrapper
Dialog Manager
Dialog (questions and answers) can be imported from the StackExchange service. After that, they can be managed in the Content > Dialog menu. Here, users can create new dialog, edit existing records, or delete them as presented in Figure 2-48. Users can also read a dialog by clicking on its title or search for dialogs using the searching box.

Figure 2‑48: List created dialogs
Figure 2-49 shows the “New/Edit Dialog”, where users can create/edit a question by entering its title, keywords, and content. The system allows some forms of simple HTML, such as p, li, strong, etc. Users click on the “Save” button to complete the creating/editing or the “Cancel” button to stop the process and go back to the listing page.

Figure 2‑49: Edit a dialog
In the listing page, users can delete a dialog by clicking on the “Delete” button at the end of each row. Figure 2-50 illustrates the final step where the system asking users if they are sure before removing the dialog from the list.

Figure 2‑50: Delete a dialog
In Figure 2-51, users can look at the questions and answers of a dialog. They can also see the upvotes for each answer and the question itself. Furthermore, users have the option to upvote or downvote an answer and the question. The timestamp and author of each answer and question are also displayed for the viewer. Finally, users can provide their answers for the posted question.
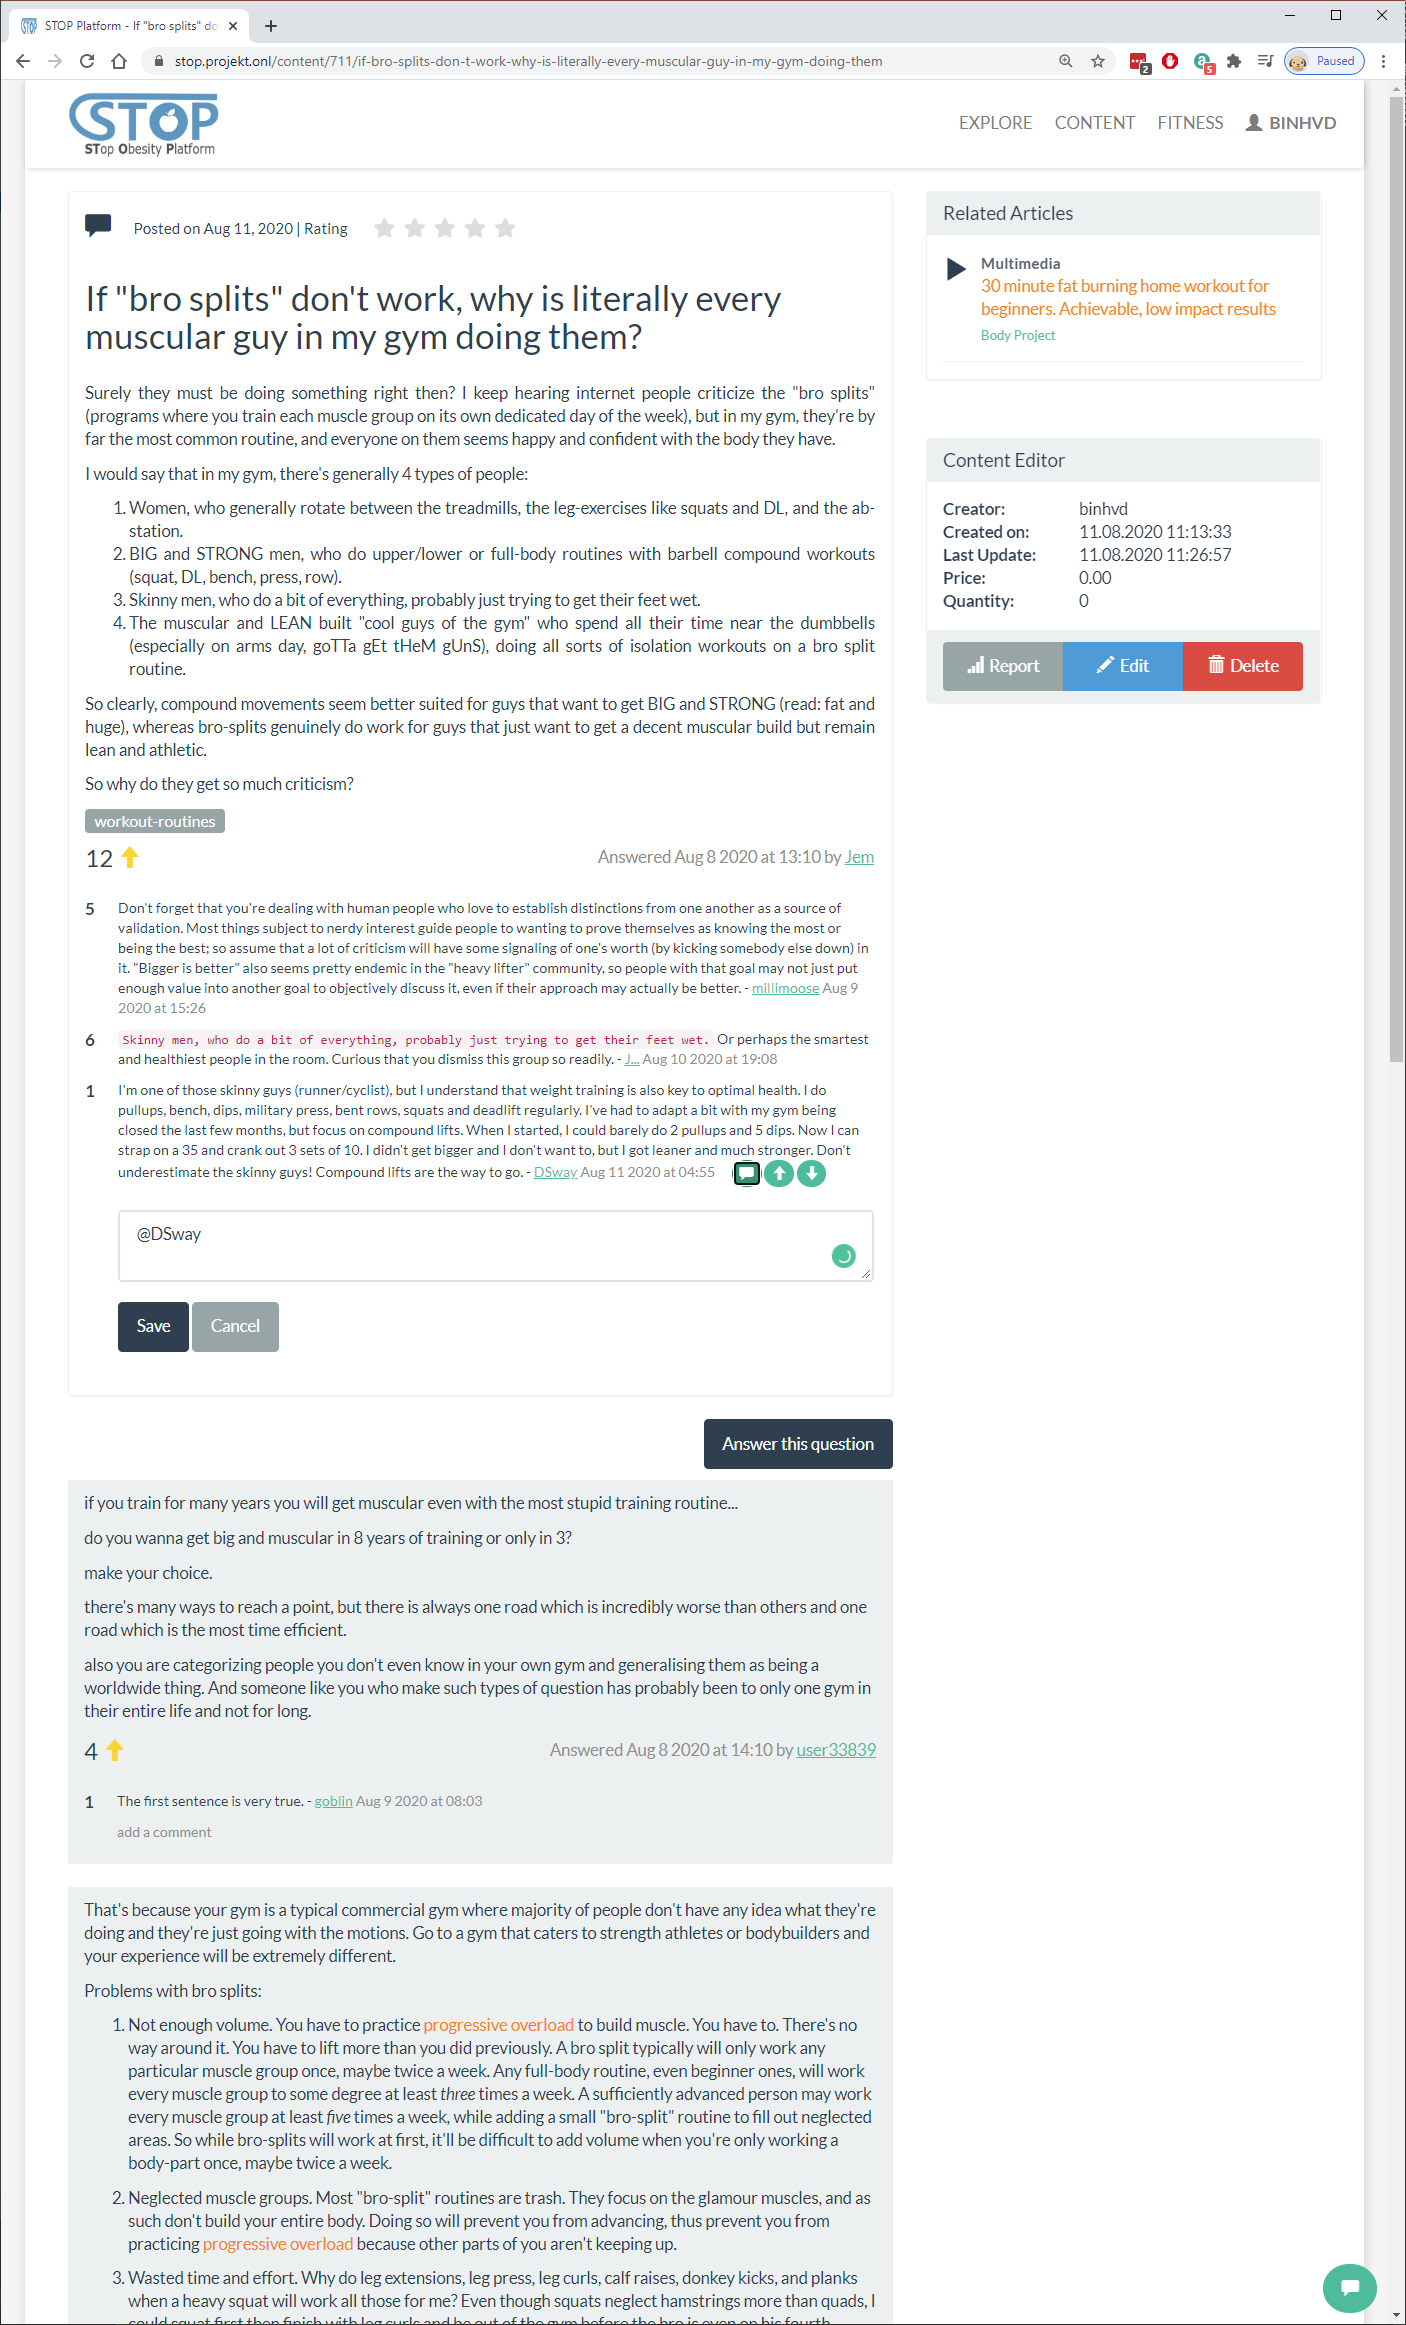
Figure 2‑51: View a dialog
Content and Knowledge Searching
Content in the STOP portal is categorized and can be searched by the users. The searching page can be reached by clicking on the “Explore” menu. As present in Figure 2-52, users can enter the searching term then clicking on the “Search” button to start the searching process. After the search result is presented to the users, they can apply filters, such as publication year, type of content, or categorization, for a narrower search result.

Figure 2‑52: Search for content
Sensory Data Fusion: Cognitive Walkthrough
In this section, the sensory Data Fusion developed in the STOP project is introduced. The system’s first release is presented in a cognitive walkthrough where its features and functionalities are described in a series of screenshots and descriptions.
Sensor Manager
Users can manage their sensors by going to the Fitness > Sensors menu. Here the list of all sensors is shown to the viewer (Figure 3-1). Simple information such as the ID of the sensors, their positions, and the number of datasets for each sensor are displayed. Users have the option to add new sensors, view their datasets, or delete sensors from the list.

Figure 3‑1: List created sensors
In the adding page, users need to choose the position of the new sensor then click on the “Create” button. They can also click on the “Cancel” button to cancel the process and go back to the listing page as shown in Figure 3-2.
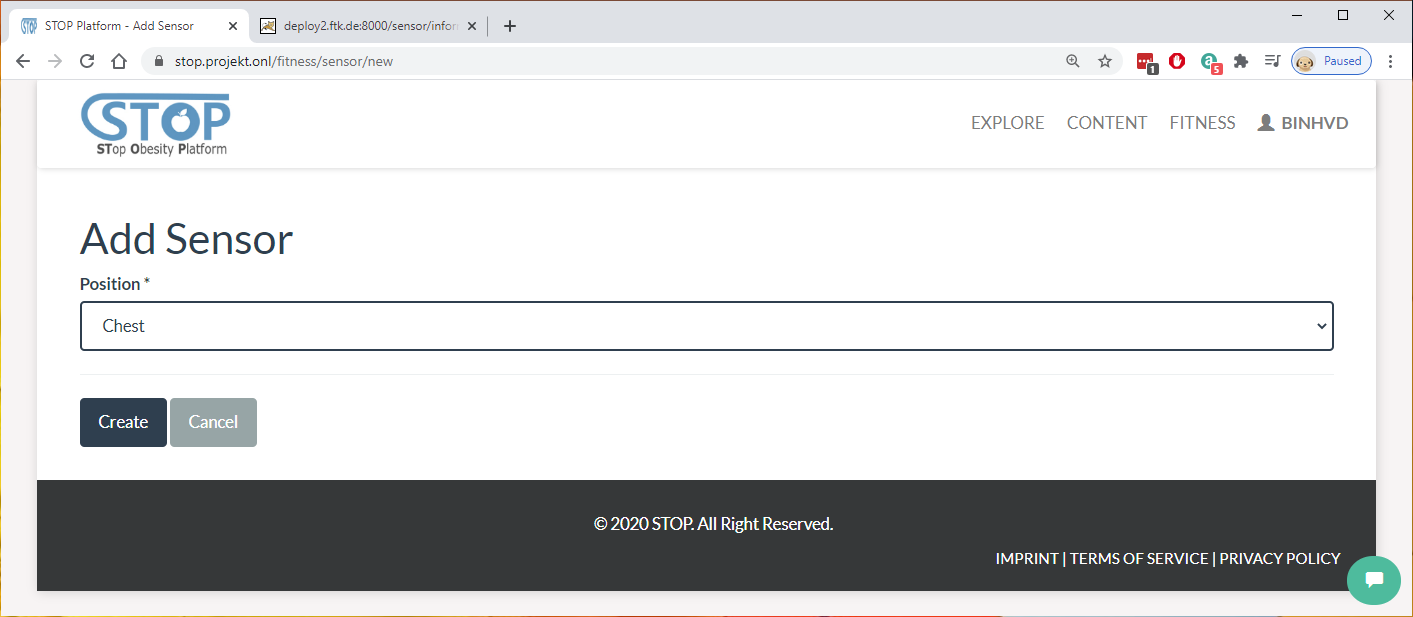
Figure 3‑2: Add a new sensor
In the listing page, users can delete a sensor by clicking on the “Delete” button at the end of each row. The system will ask users if they are sure before removing the sensor from the list (Figure 3-3).

Figure 3‑3: Delete a sensor
Dataset Manager
In the dataset listing page presented in Figure 3-4, users can browse and search for datasets of a chosen sensor. The list shows all datasets belong to a sensor including their IDs, created dates, frequencies, and activities. Users have the option to add new datasets, view them, or delete them from the list.

Figure 3‑4: List all datasets of a sensor
In the adding page (Figure 3-5), users need to select dataset name, enter its frequency, and select the activity, which was recorded. The raw data in CSV format can be uploaded to the system using the upload field.

Figure 3‑5: Add a dataset
In the listing page, users can delete a dataset by clicking on the “Delete” button at the end of each row. Figure 3-6 presents the confirmation step where the system asks users if they are sure before removing the dataset from the sensor.

Figure 3‑6: Delete a dataset
Data Visualization
This section introduces the visualization features and functionalities of the STOP portal. Fitness and sensory data are collected and visualized for the users to have better overview and understanding of their activities, food and water consumptions, and exercises. There are 3 categories where data is visualized. They are fitness tracking for current date, fitness history, and sensory dataset.
Fitness Overview
The Fitness Overview provides a quick look at users’ fitness current progress compare to their target each day. This feature can be accessed from the Fitness > Overview menu. In figure 4-1, users’ current status in water consumption, food consumption, exercises, and steps, are visualized. Meanwhile, the target is either calculated by the system based on user’s fitness profile or imported from an external service, such as Fitbit. Users will need to overcome this target in order to reach their fitness goal.

Figure 4‑1: Fitness overview minimized
Each category in the Fitness Overview can be expanded or hidden. The “Today” tab shown in Figure 4-2 provides a quick overview of water consumption, food consumption, exercise, or activity by listing all records belong to these categories created in the current day. The Add buttons provide quick access for the users to add more record. Users can quickly import new data from their wearable device by clicking on the “Sync Now” button without going to the Synchronize menu.

Figure 4‑2: Fitness overview maximized
Fitness History
Unlike the “Today” tab, where all data in a day is presented, the “History” tab (Figure 4-3) visualize fitness data from a date range. Users can select a start and end date where they want to visualize all the records created inside this period. After clicked on the “View History” button, a chart with 2 axes will be generated for each category, such as steps, exercises, meals, waters. This helps users to have a better view over their activities over time.

Figure 4‑3: Fitness activities over time
Sensory Dataset
Another visualization users can use is viewing the dataset as shown in Figure 4-4. While viewing a dataset, users can read all information related to it, such as ID, frequency, activity. Furthermore, they can preview the data in the CSV format and download the full file. Finally, a chat with 2 axes that visualize that data is presented.

Figure 4‑4: View a dataset
Feasibility Study Preparation
The output of this deliverable is in the mean of a demonstration. Beside the screenshots presented in this document, a demonstration video can be found here:
The video was uploaded to the STOP portal and published using the same knowledge management system presented in this document.
Furthermore, the STOP Data and Knowledge Management, Pre-Processing, and User Interaction that was shown here will be re-used in the feasibility study, which is scheduled in the next few months. The system then can be extended and adapted based on the result of this study.
The procedure as well as result of the feasibility study will be reported in another deliverable.